Analytics screen examples
Analytics screen design examples from SaaS apps. Browse examples from Dock, Exa, Navattic.
Explore the examples
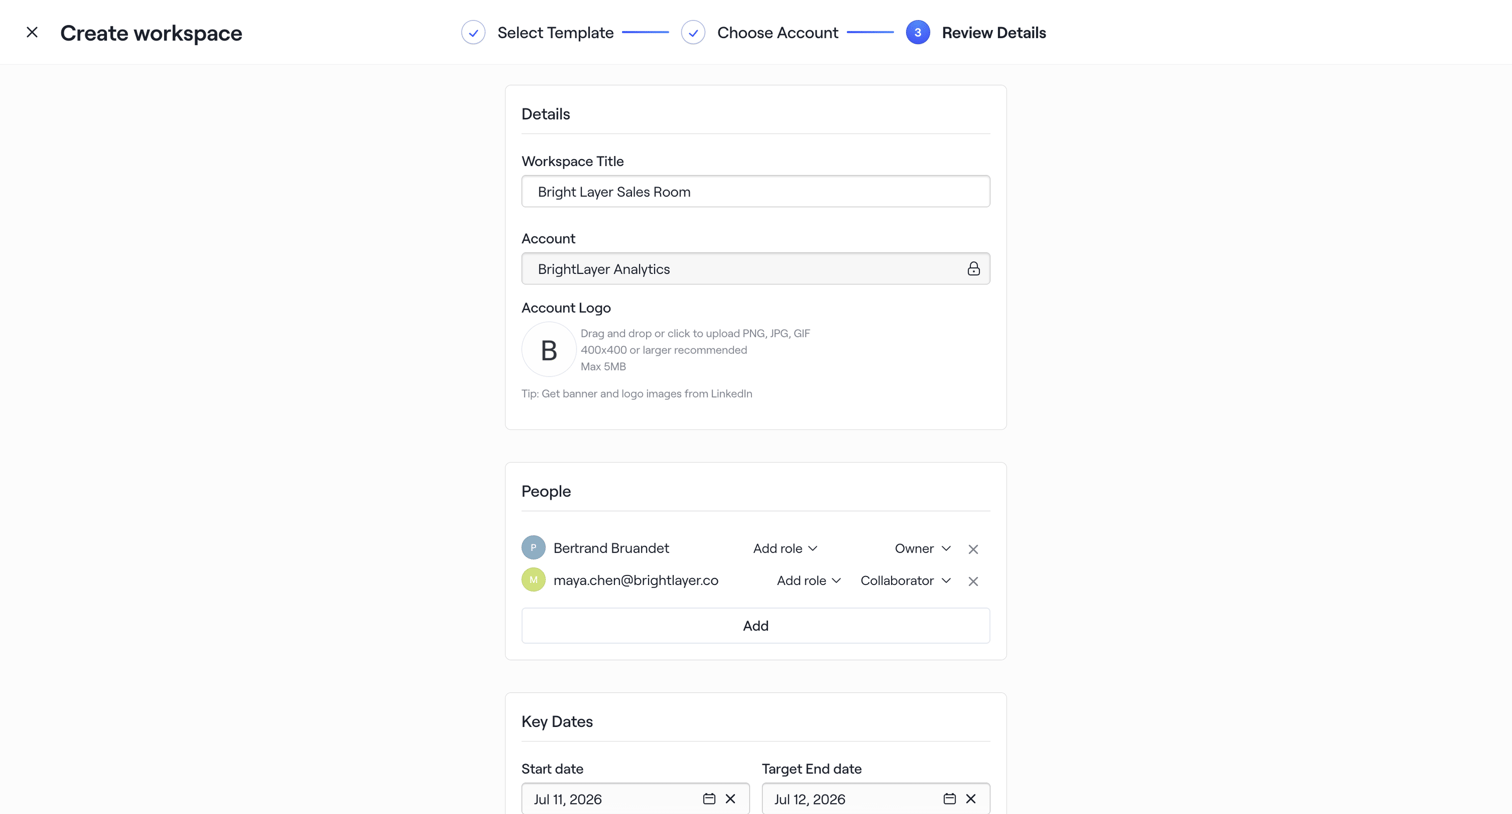

Creation wizard step where the user reviews details, assigns team members with specific roles, and sets key dates before finalizing the workspace.
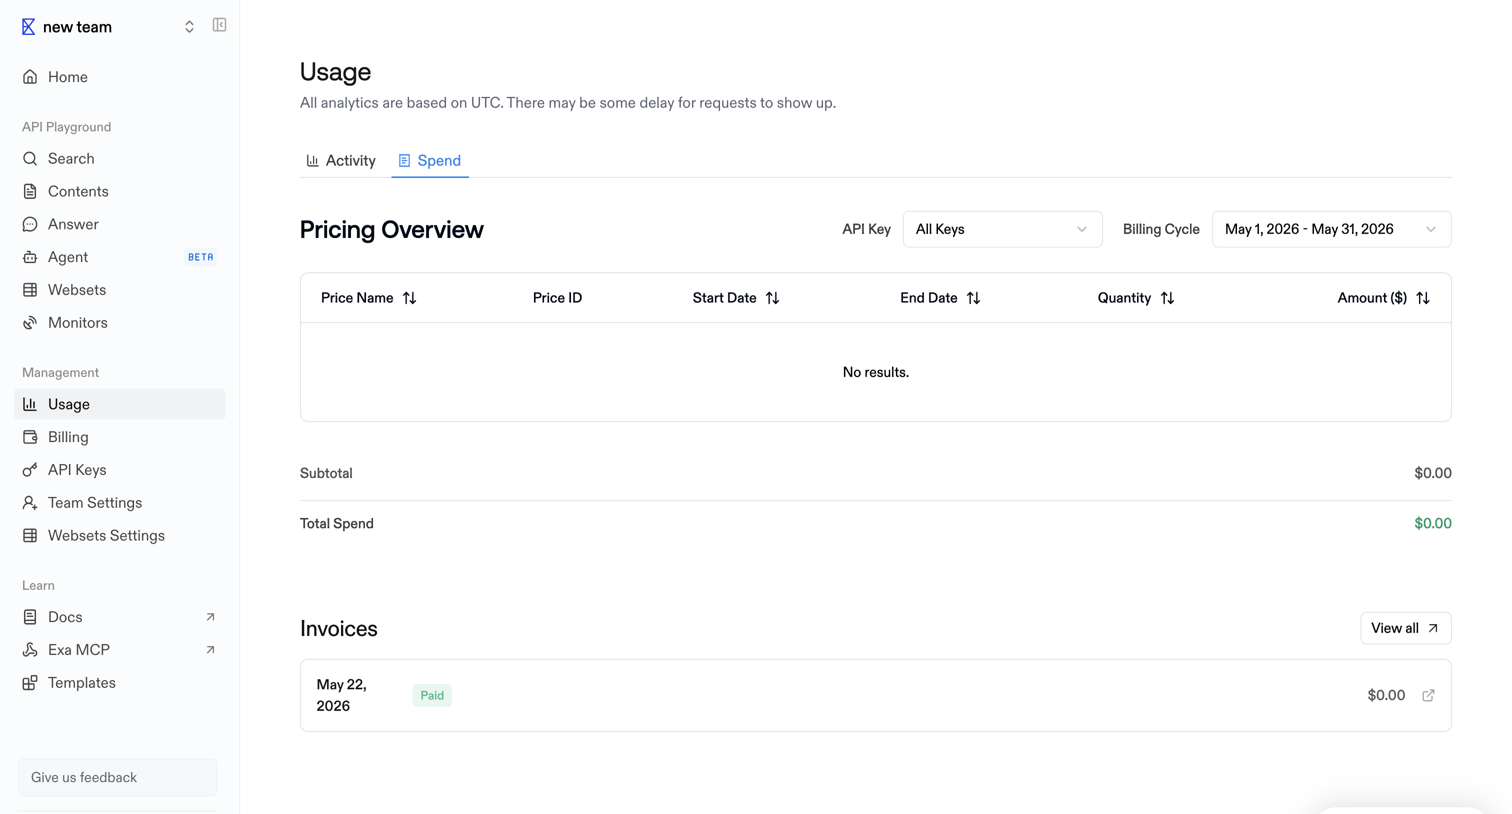

Usage settings page where the user views their pricing overview filtered by API key and billing cycle, along with a history of past invoices.
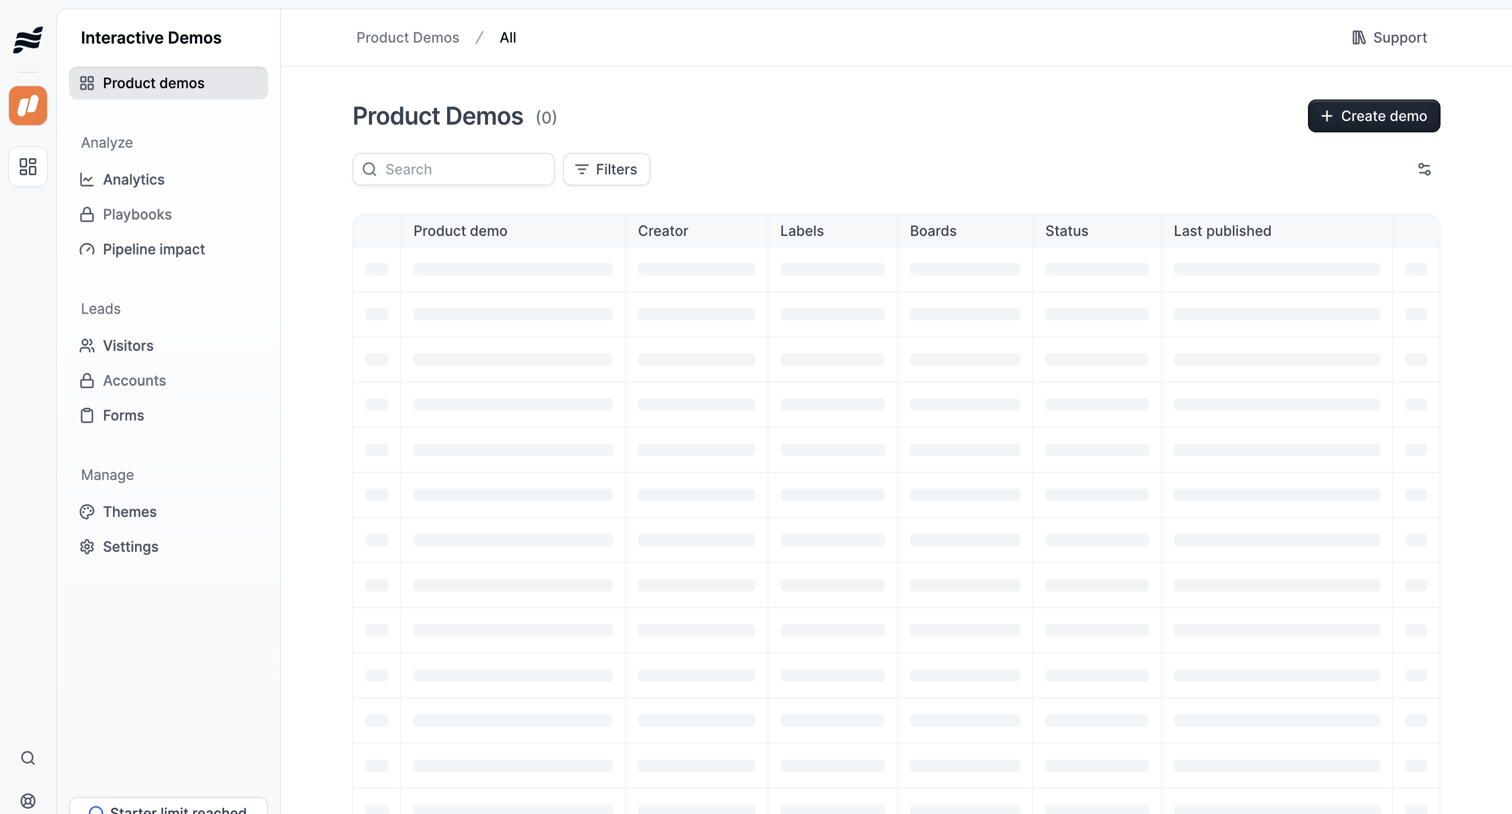

List view where the user manages product demos, currently showing a skeleton loading state for the data table alongside search and filter controls.
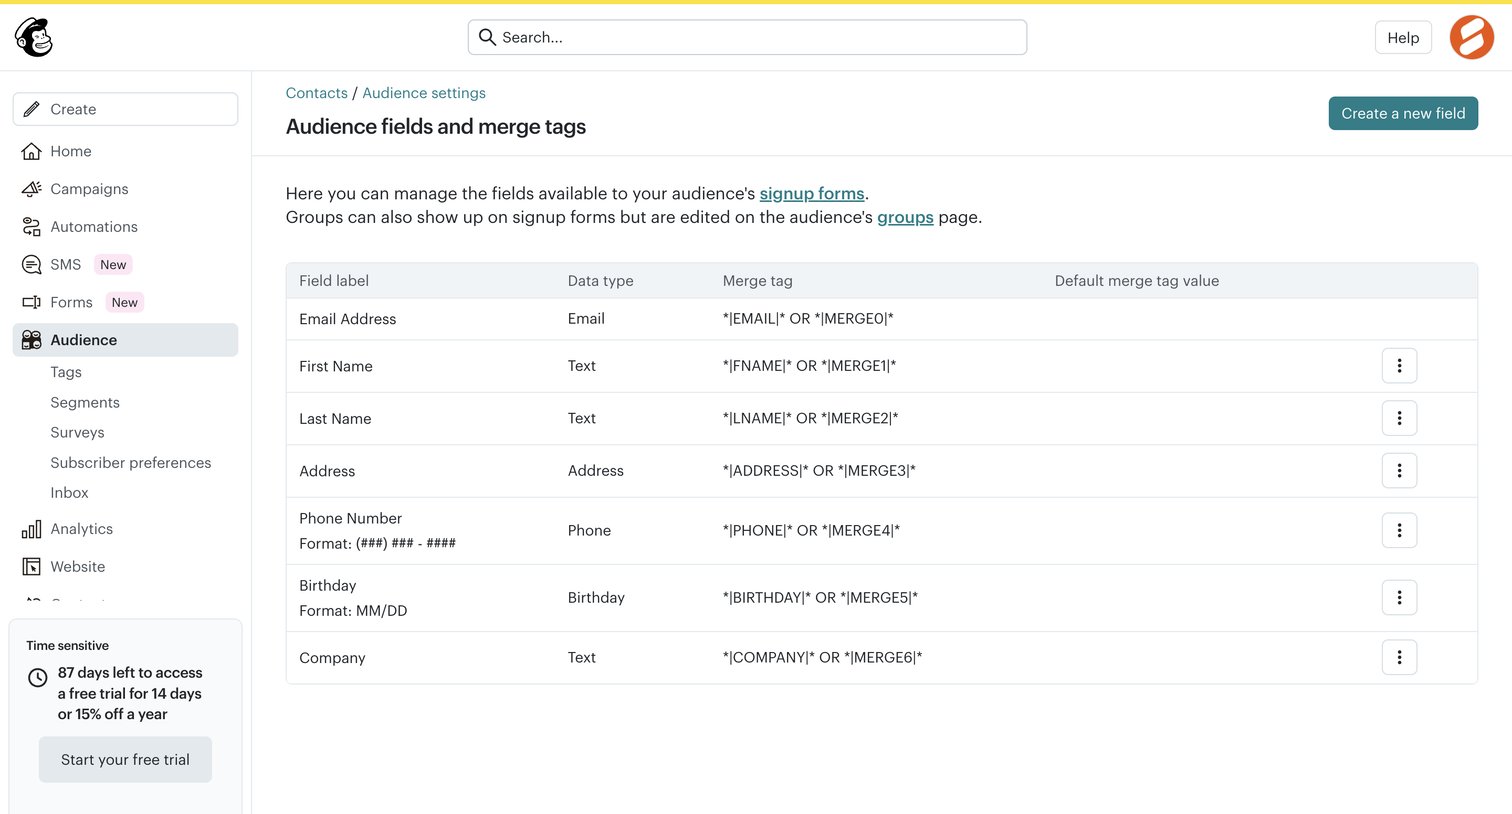

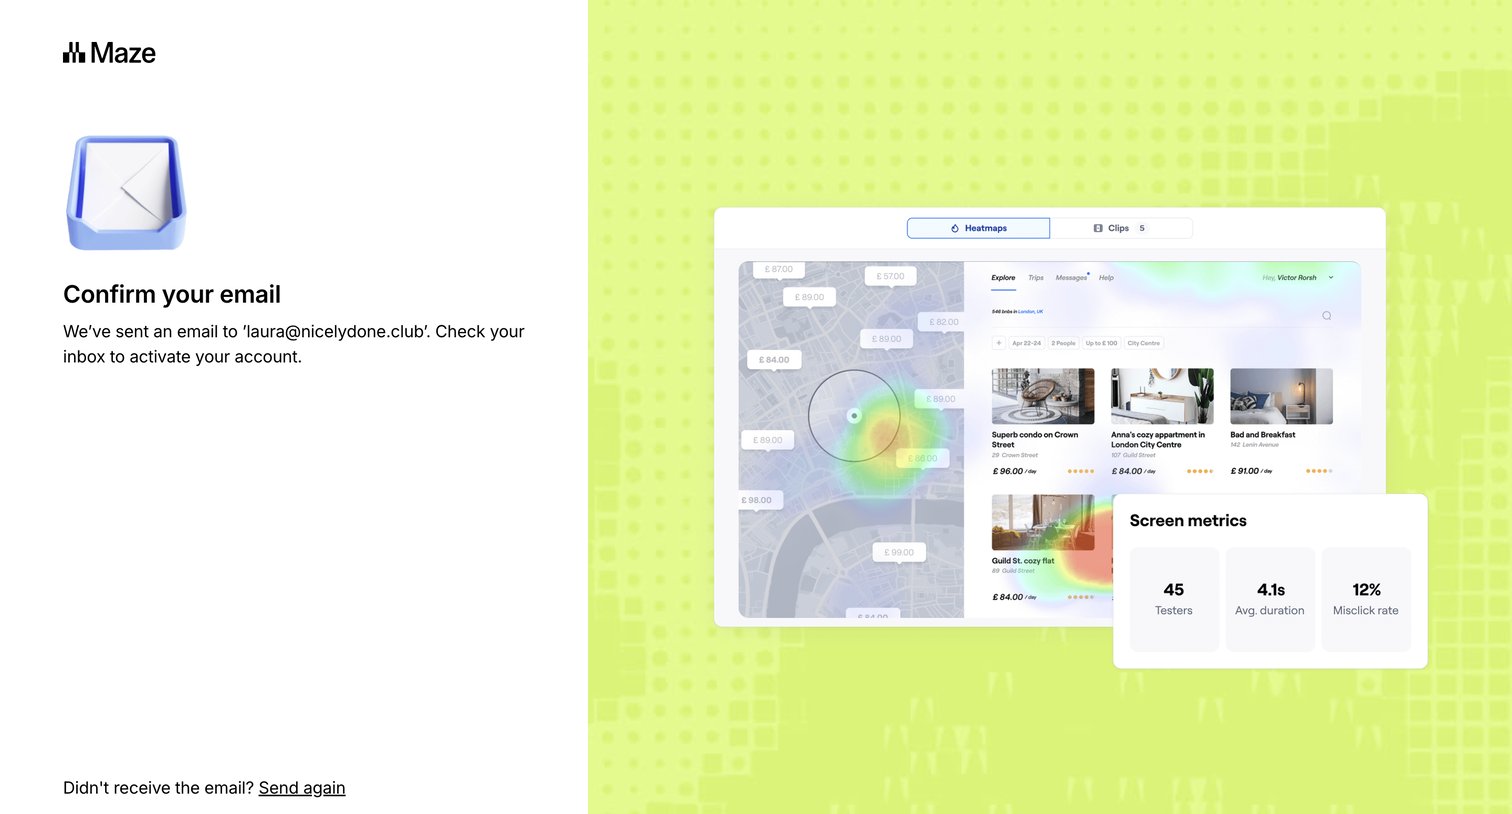

Verification screen where the user is instructed to check their email inbox to activate their account, with options to resend the email or return to signup.
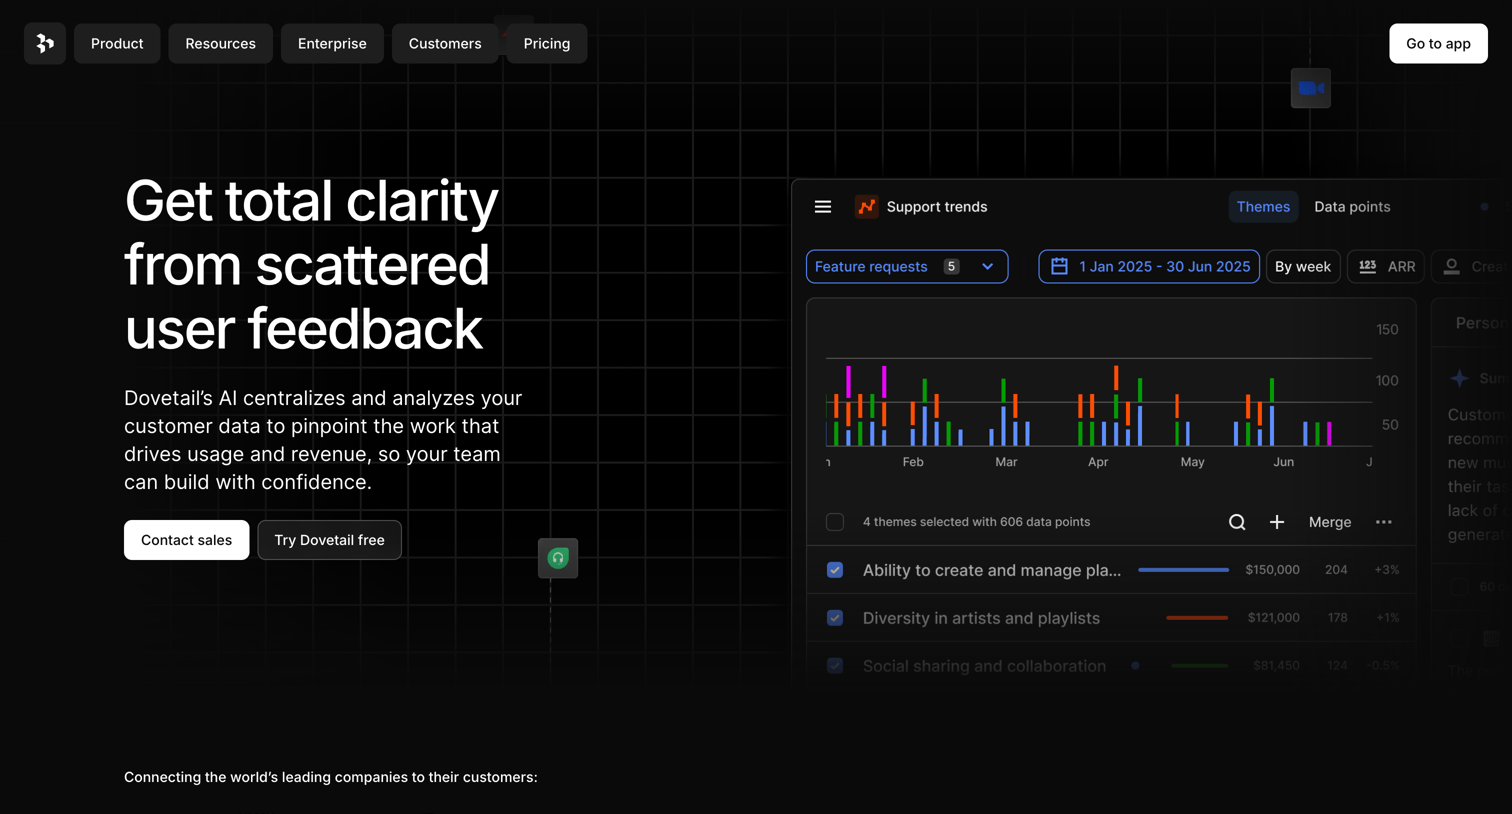

Landing page hero section pitching an AI-powered user feedback analysis tool, featuring a product UI mockup showing support trends and theme analysis.
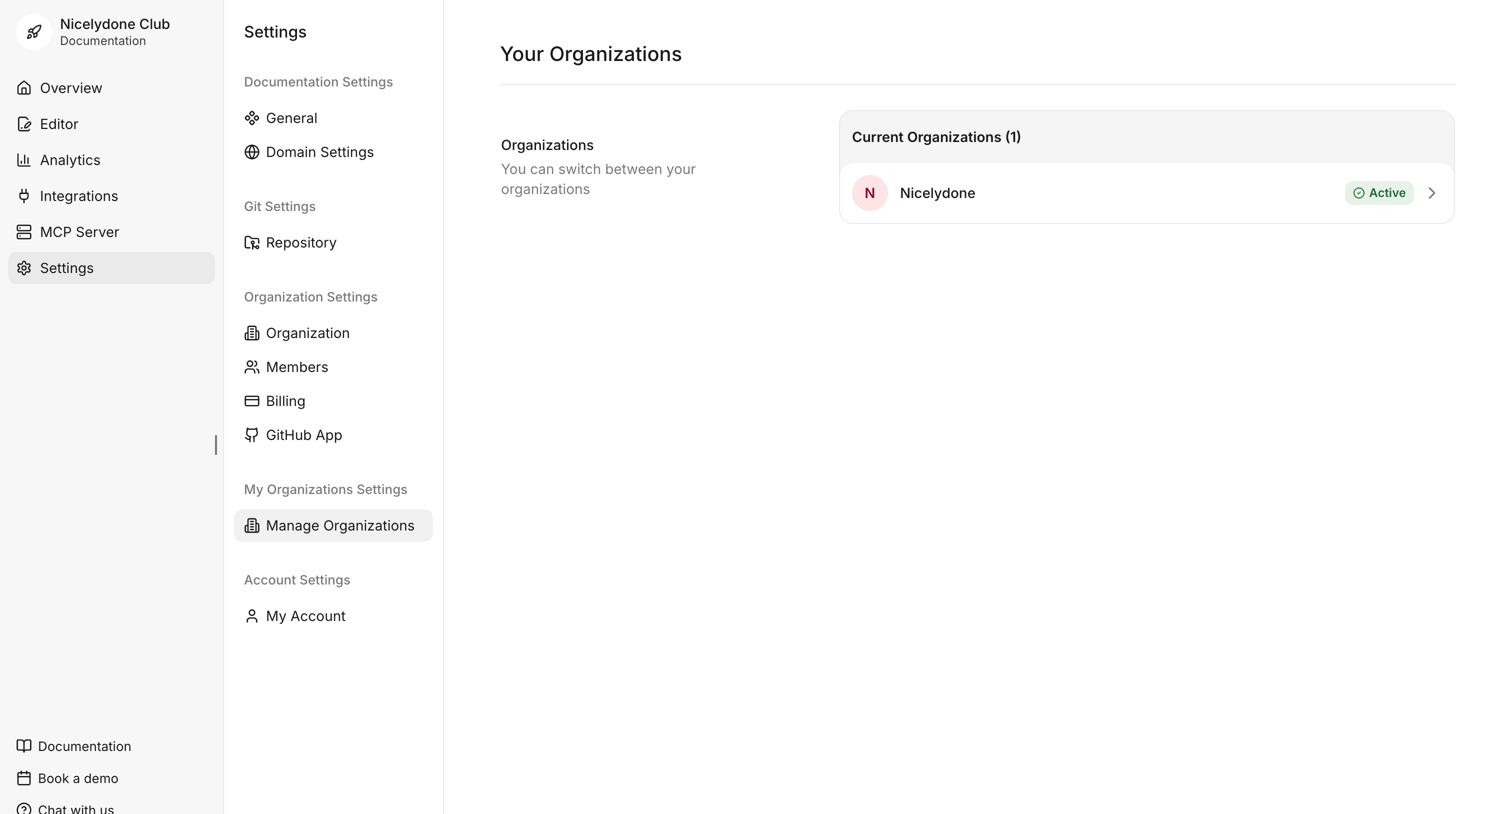

Settings page where the user views their current organizations and can switch between active workspaces.
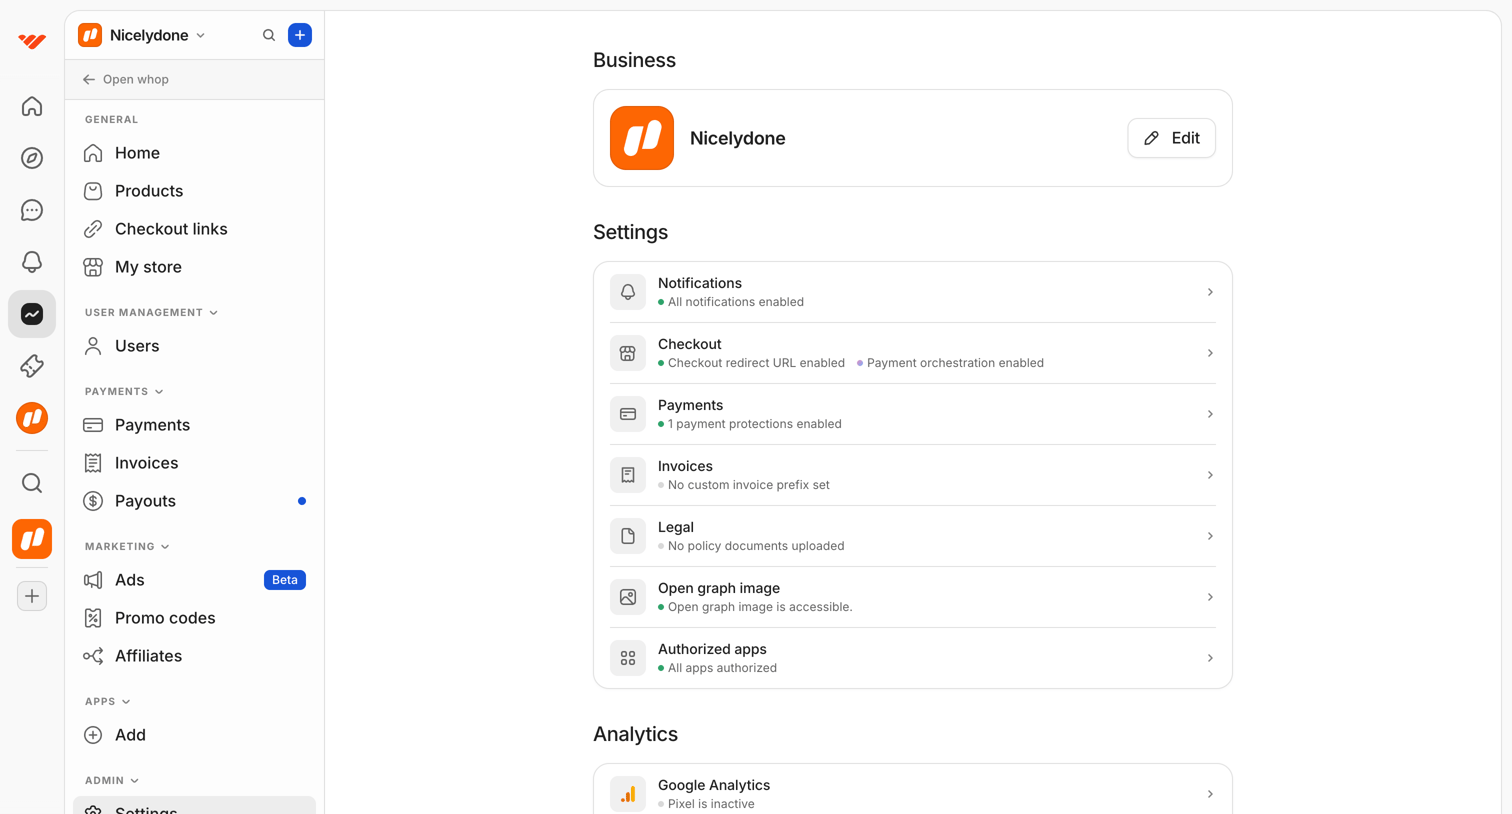

Settings overview page where the user can access business details, configuration categories like checkout and payments, and analytics integrations.
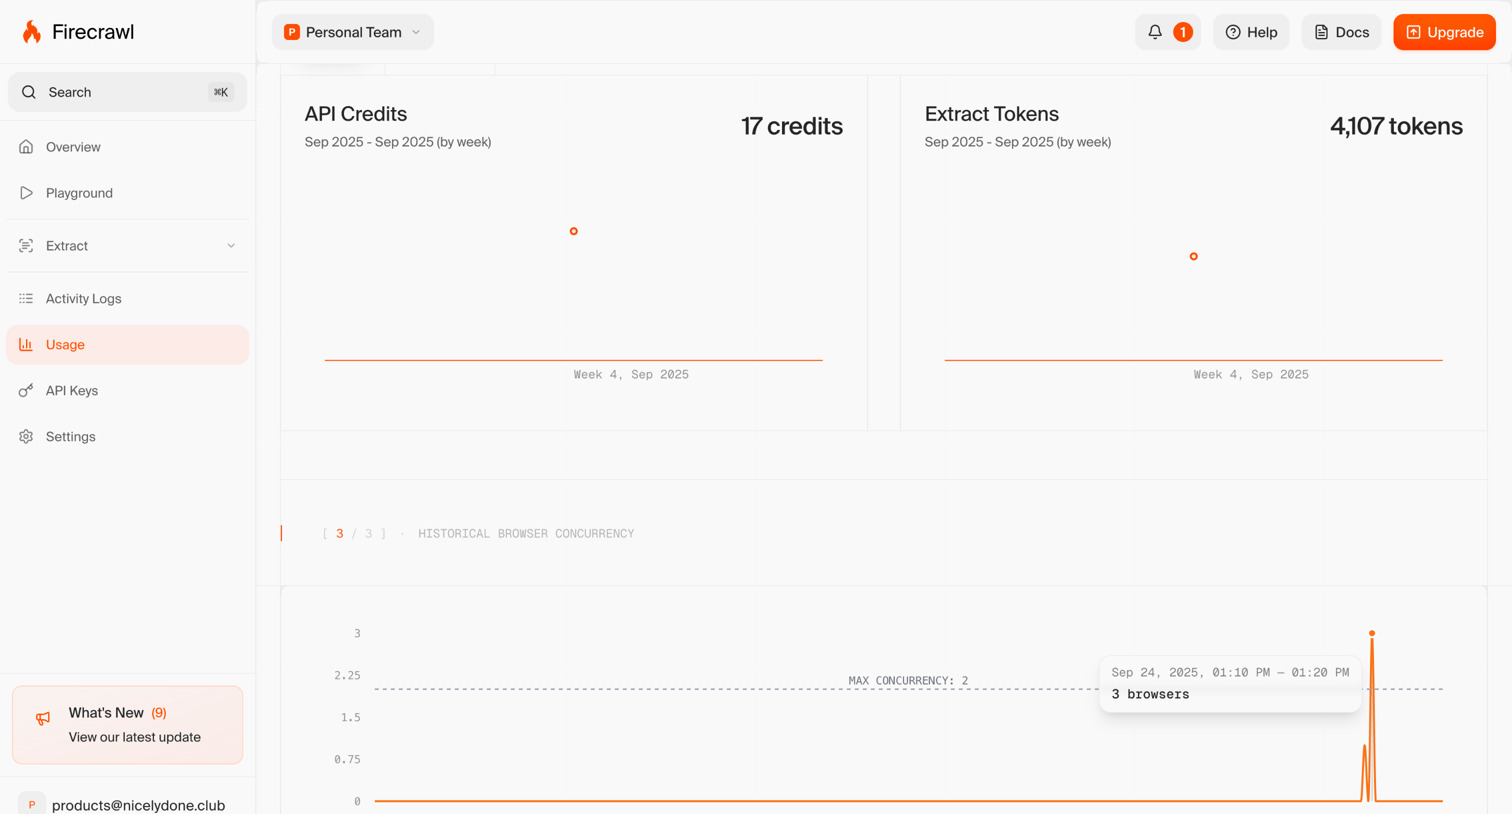

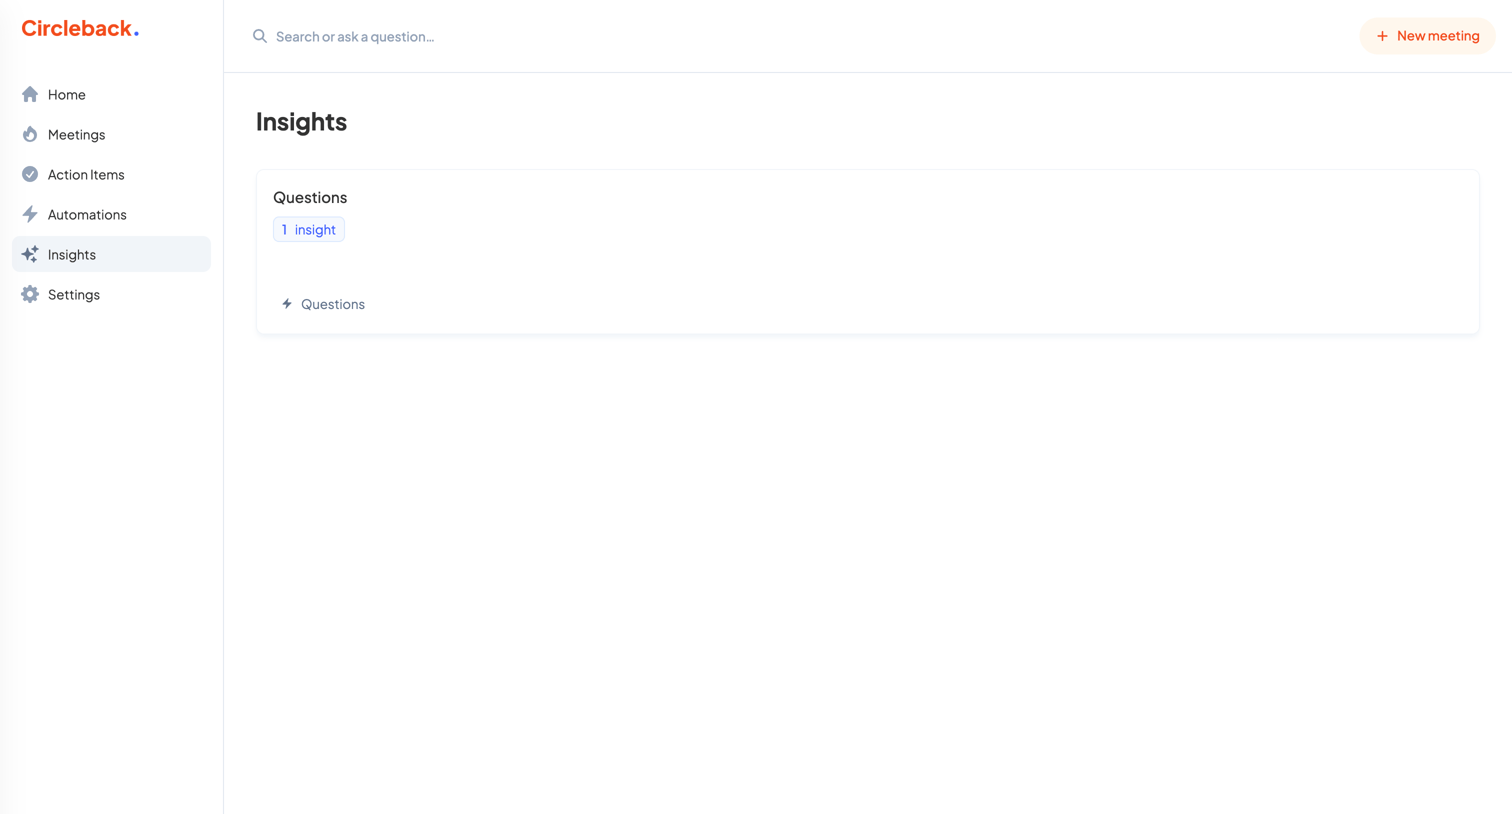

Insights dashboard where the user views extracted questions and other key takeaways from their recorded meetings.


Explore the full SaaS screen library
Upgrade to unlock the full library.
Trusted by the best teams







