Report screen examples
Report screen design examples from SaaS apps. See how apps let people flag content, accounts, or problems for review. Explore how reporting forms ask for a reason and explain the next action.
Explore the examples
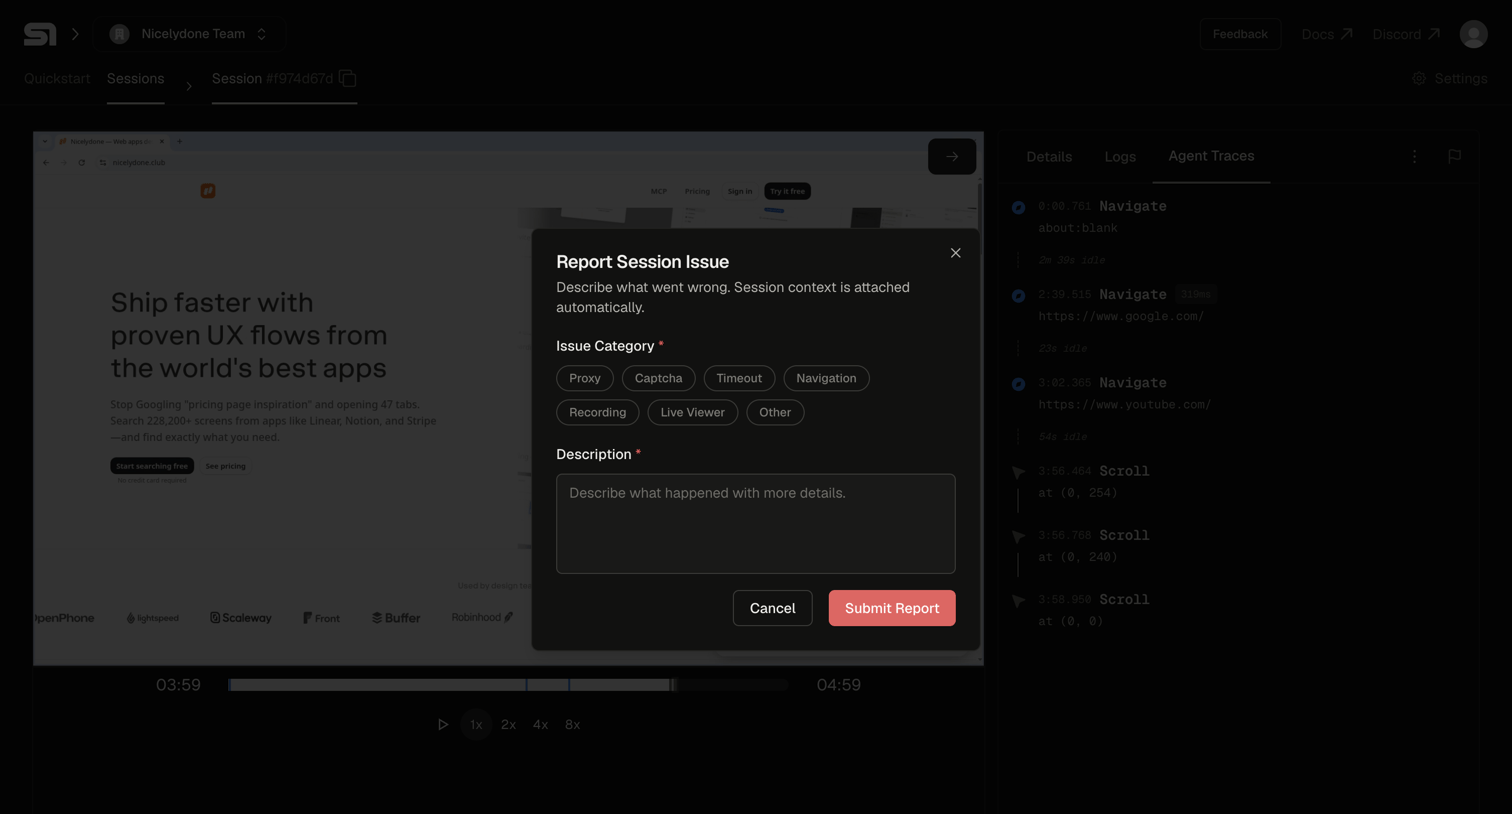

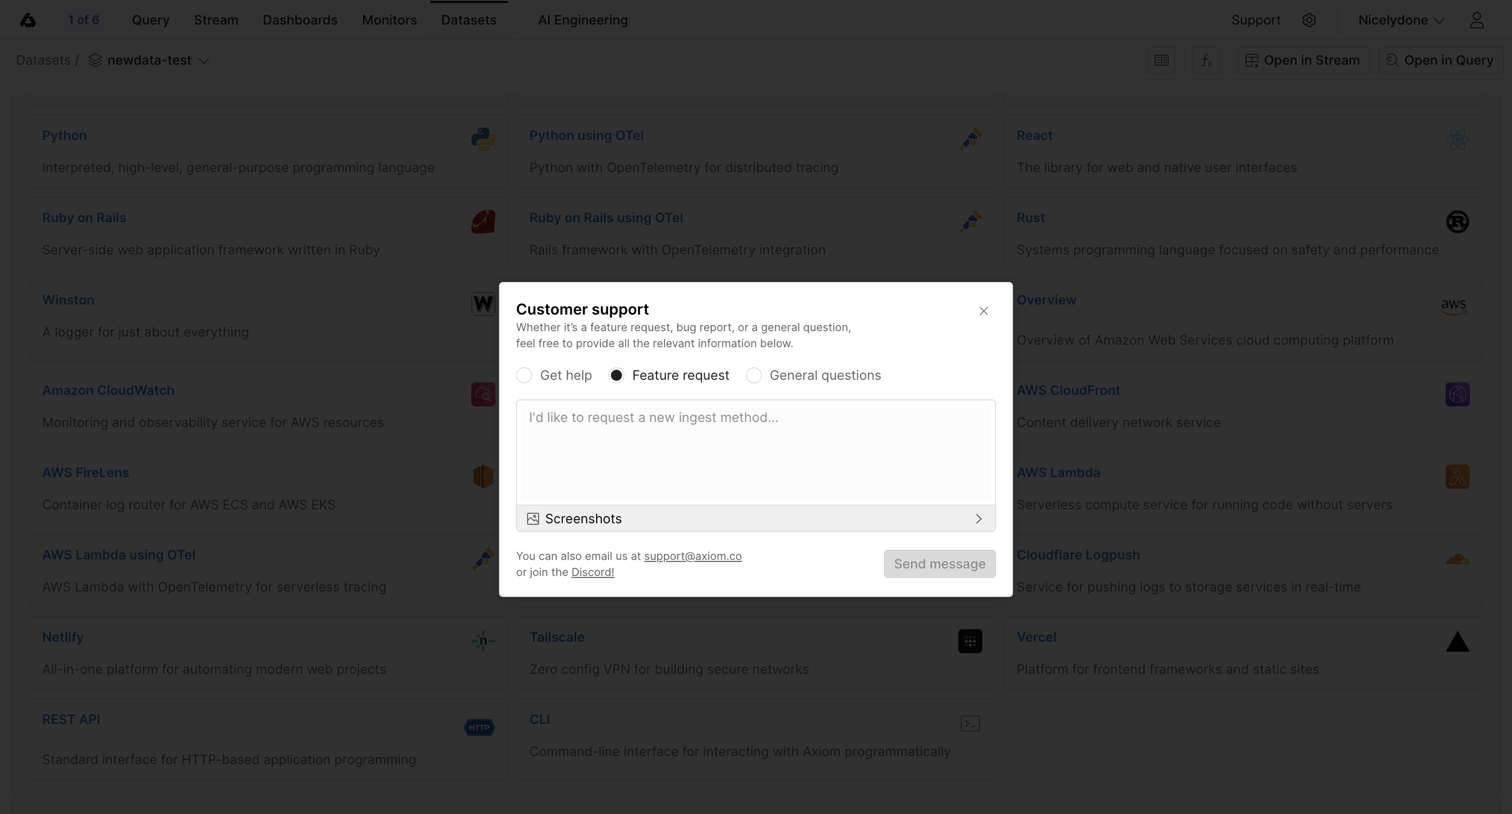

Dataset detail page where the user has opened a customer support modal to submit a feature request for a new ingest method.
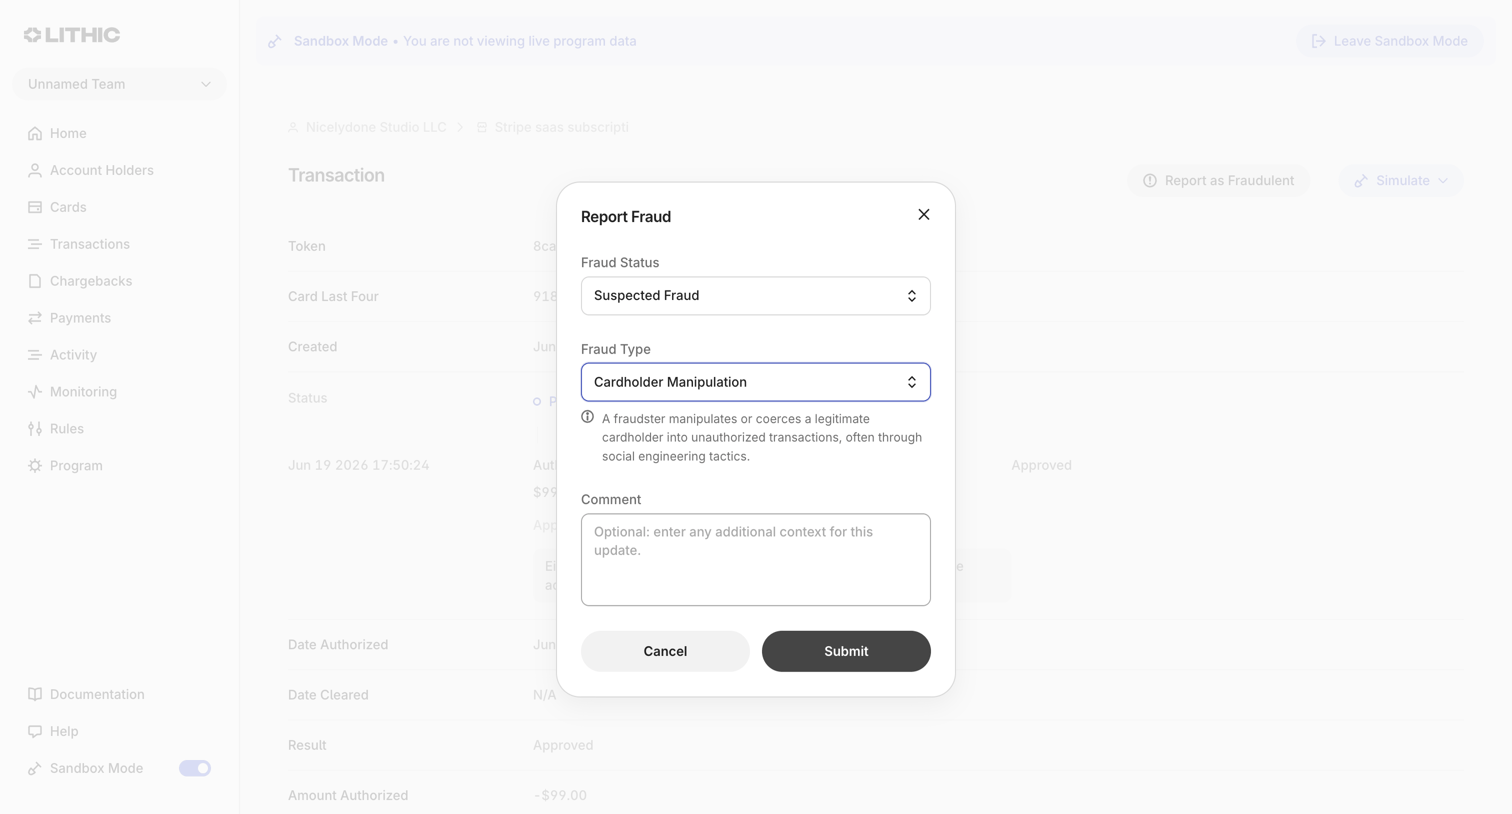

Detail page for a transaction where the user is reporting it as fraud via a modal, selecting a fraud status and type.
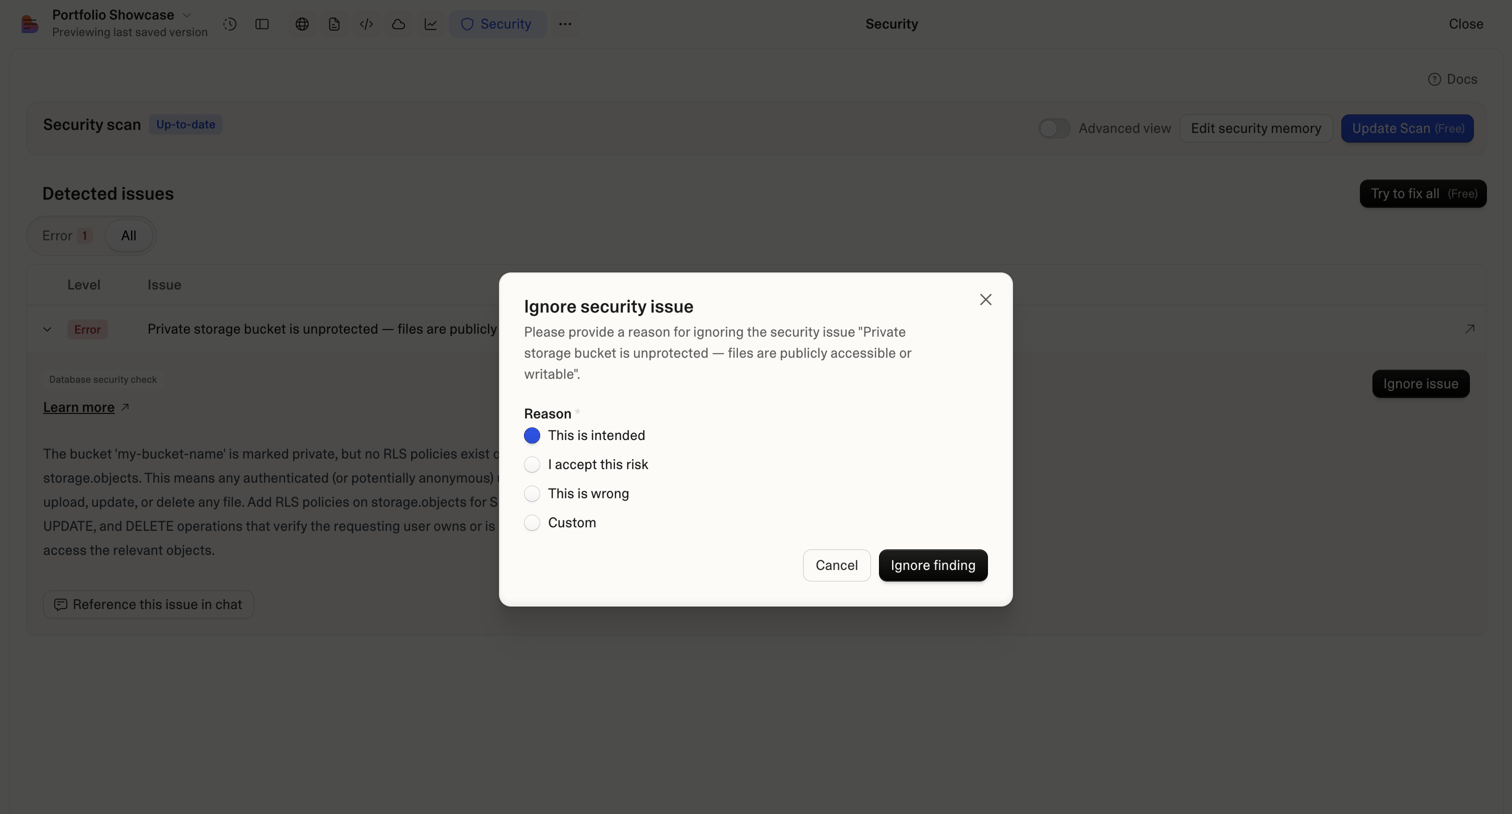

List view where the user is prompted to provide a risk acceptance reason for ignoring a specific database security vulnerability via a modal.
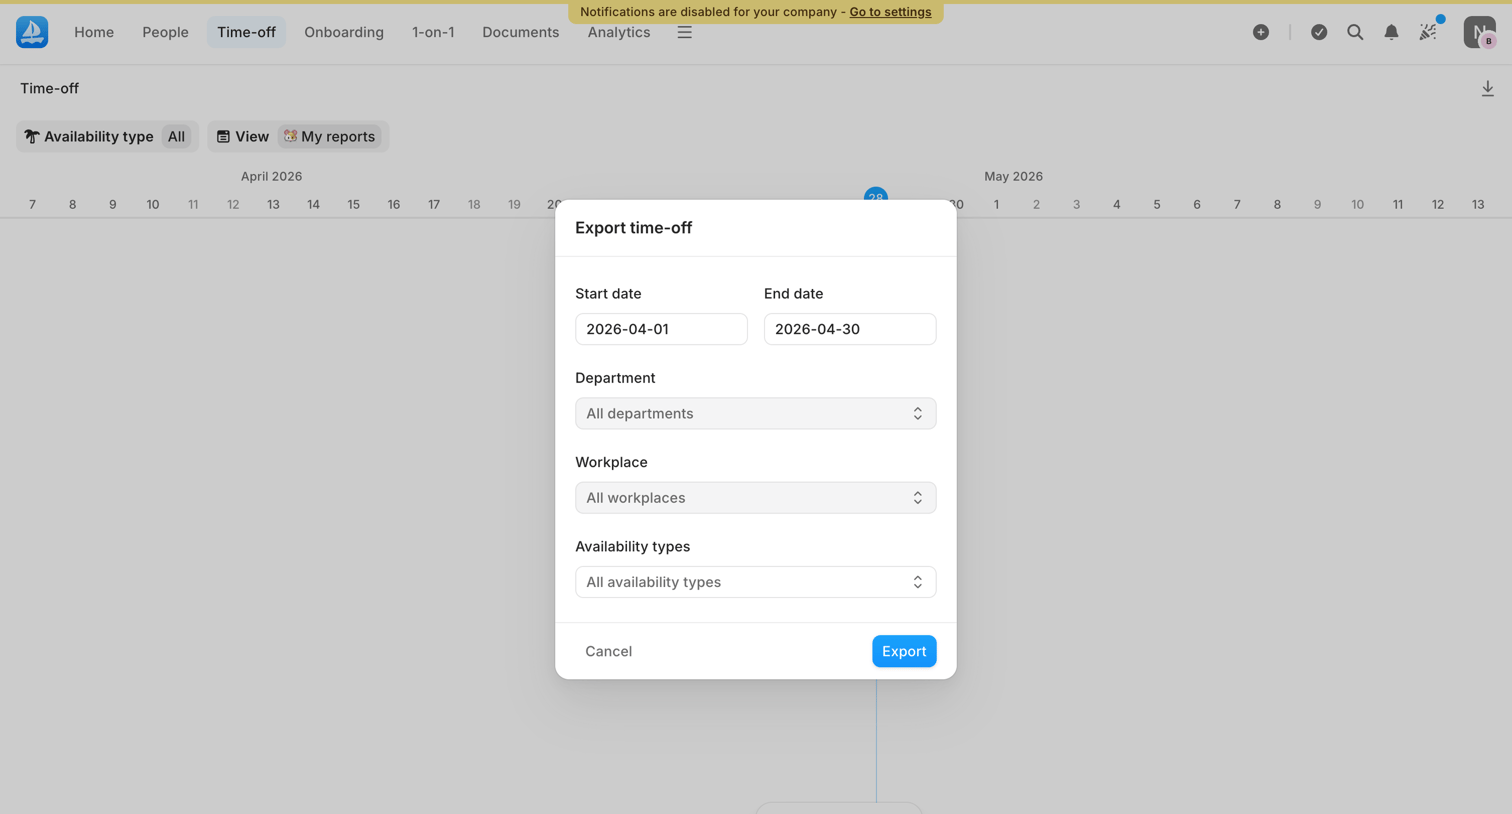

Modal where the user configures a date range, department, workplace, and availability types to export a time-off report.
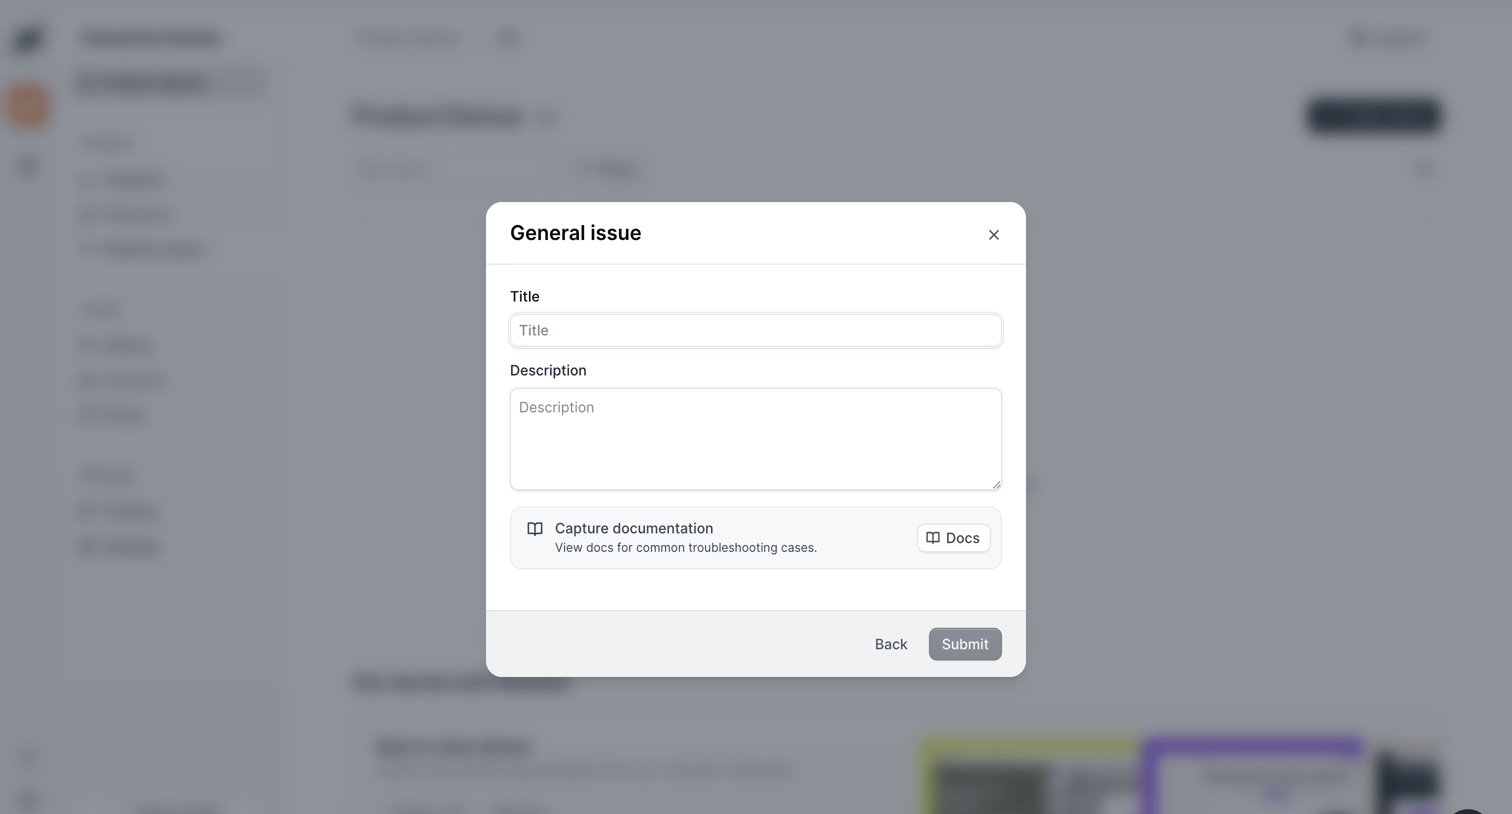

List view where the user is reporting a general issue via a modal form containing title and description fields.
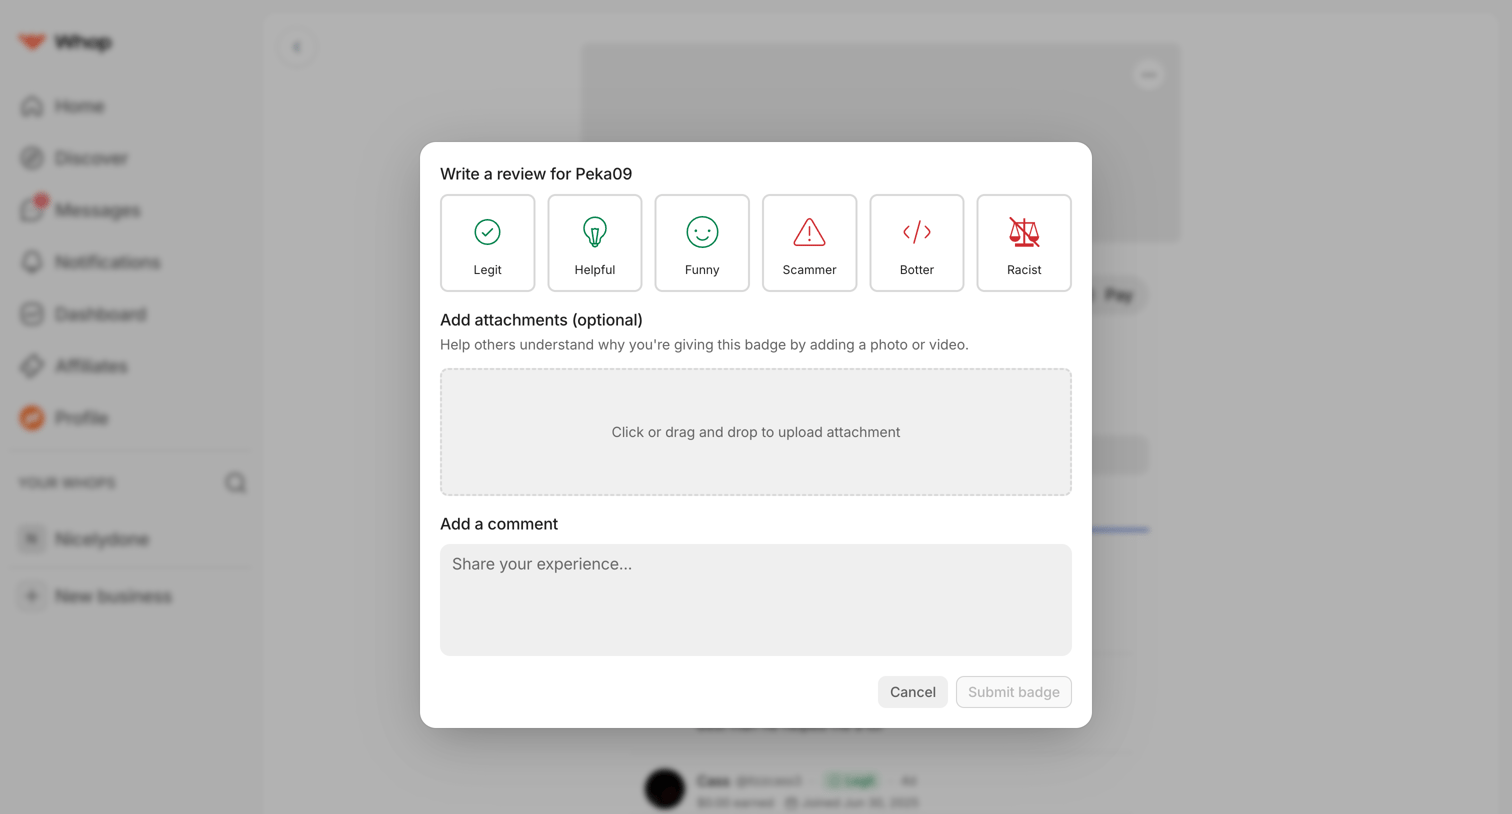

Detail page where the user selects a badge, uploads an optional attachment, and writes a comment to submit a review for another user's profile.
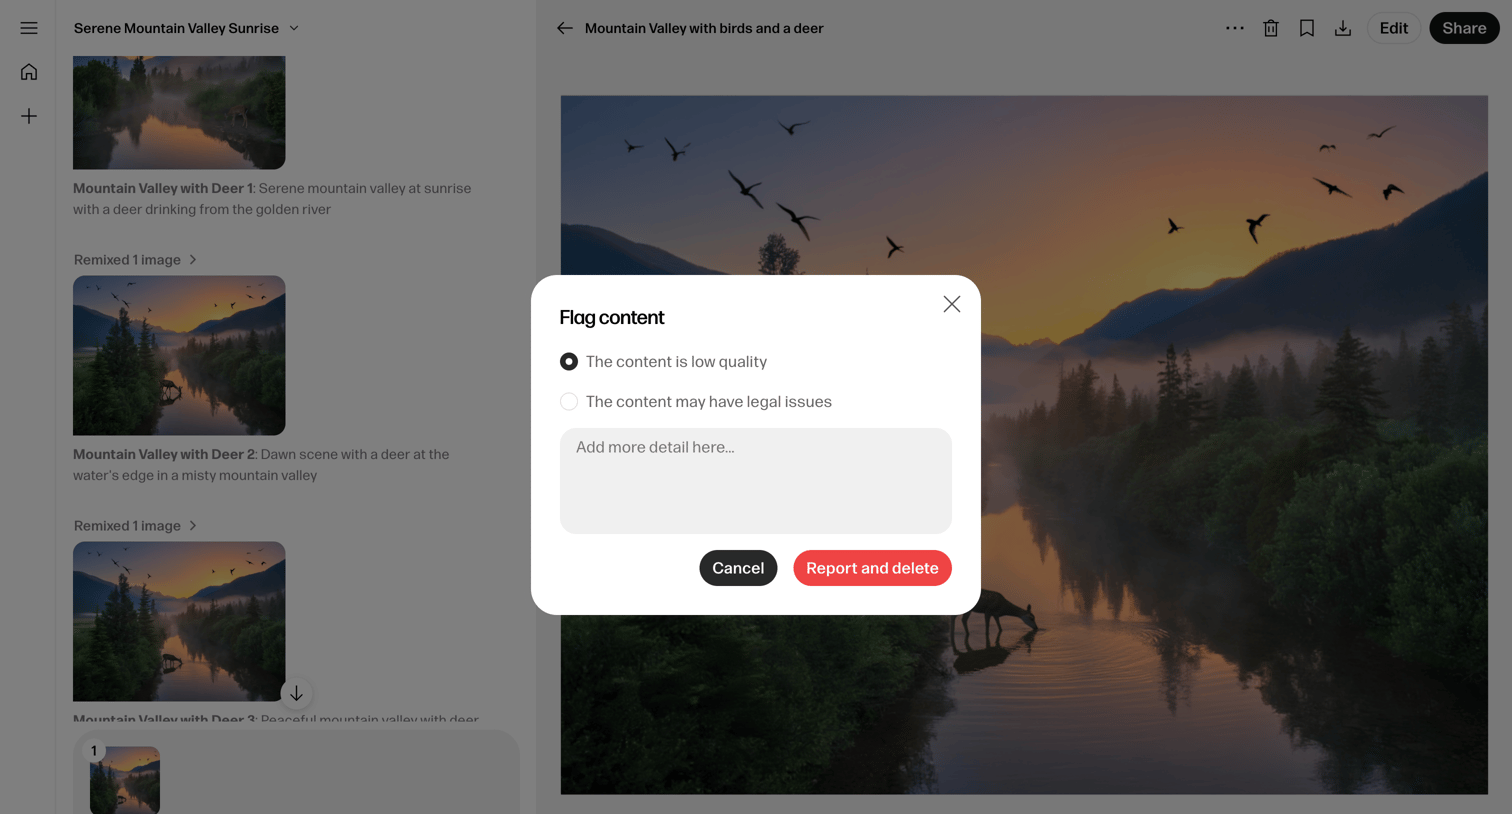

AI image generation interface where the user is reporting a generated image for low quality or legal issues via a flag content modal.
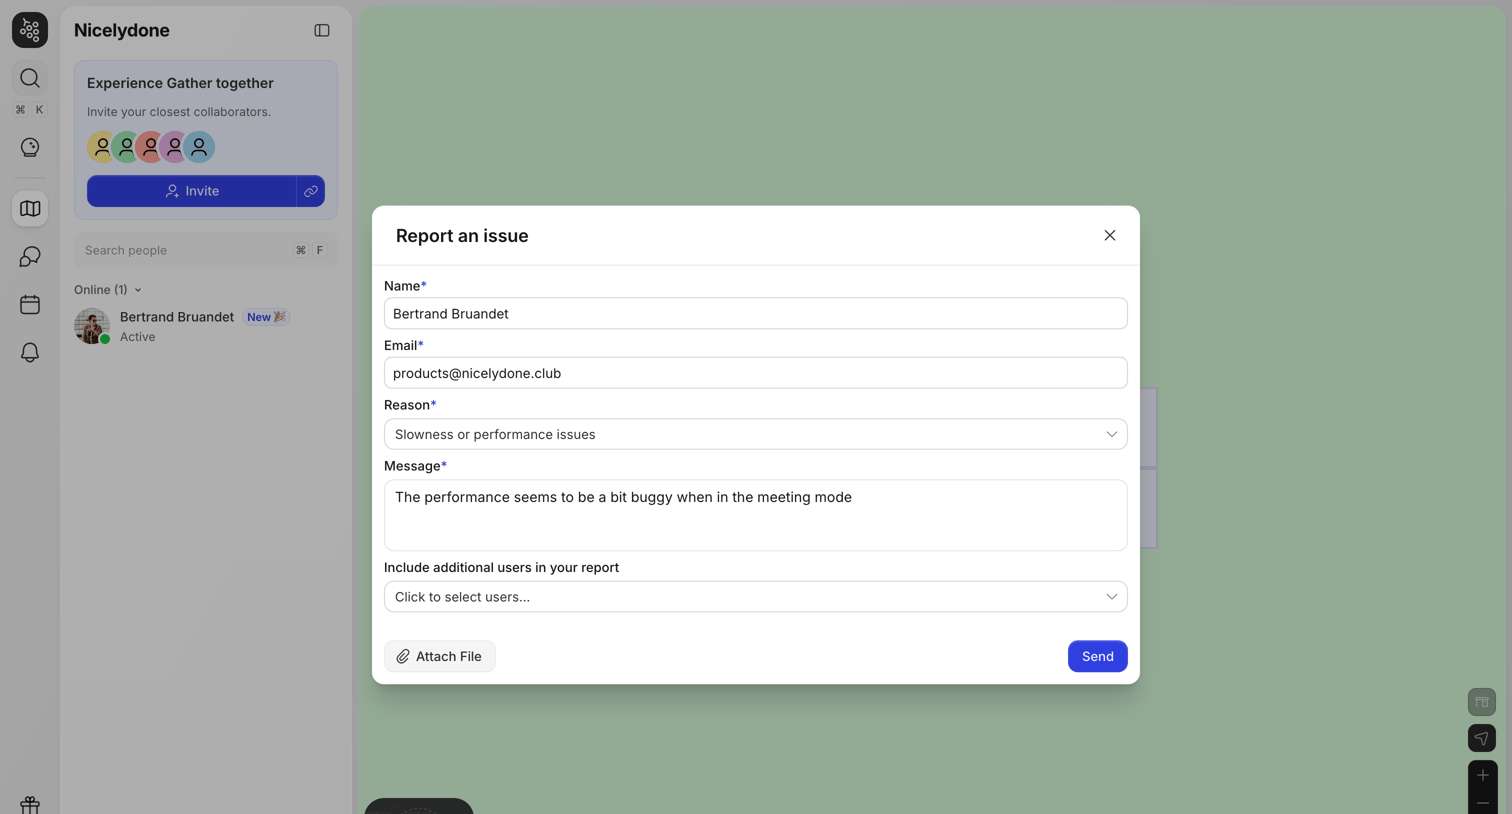

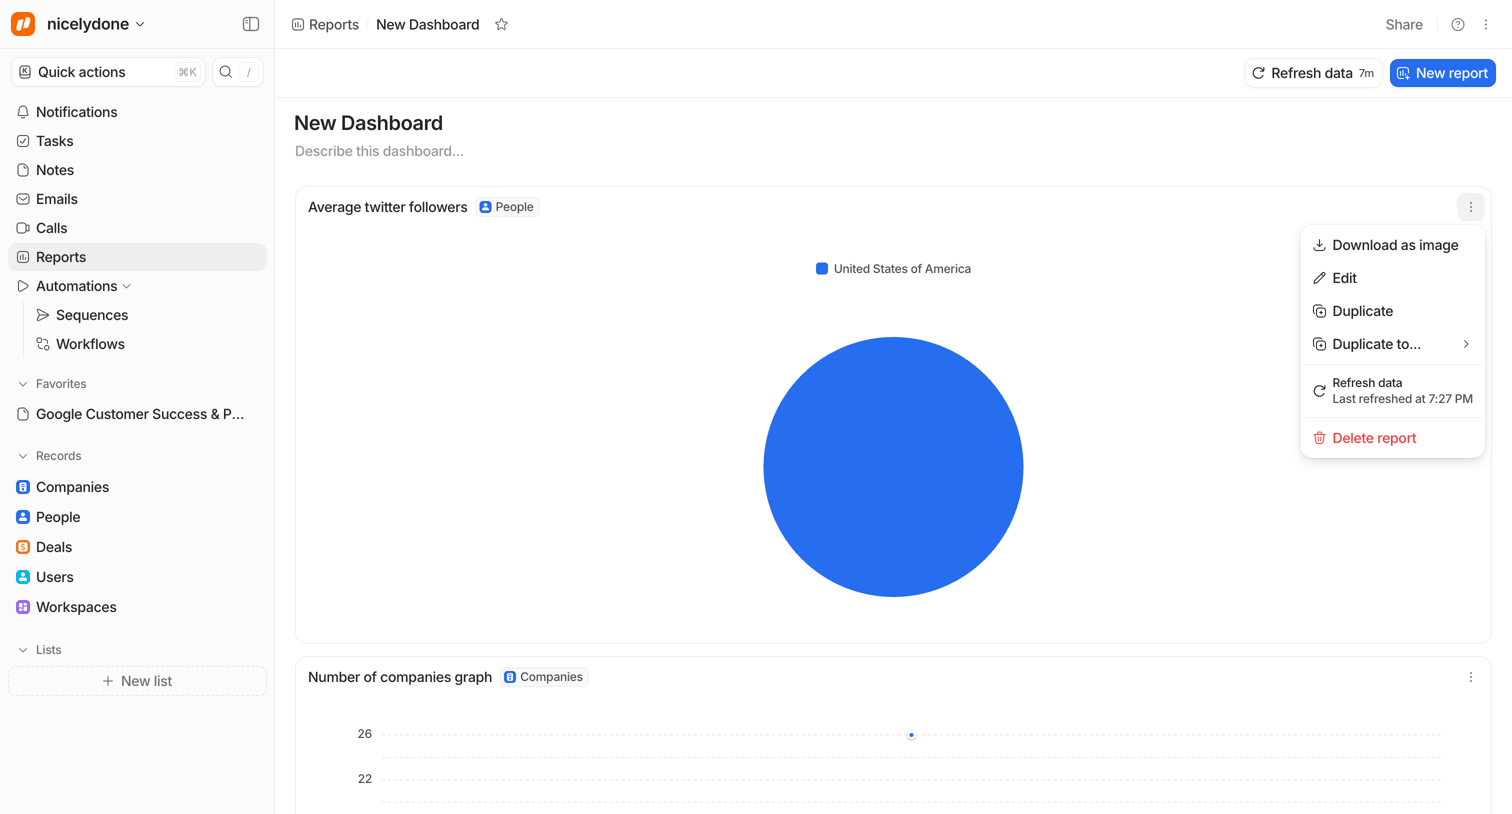

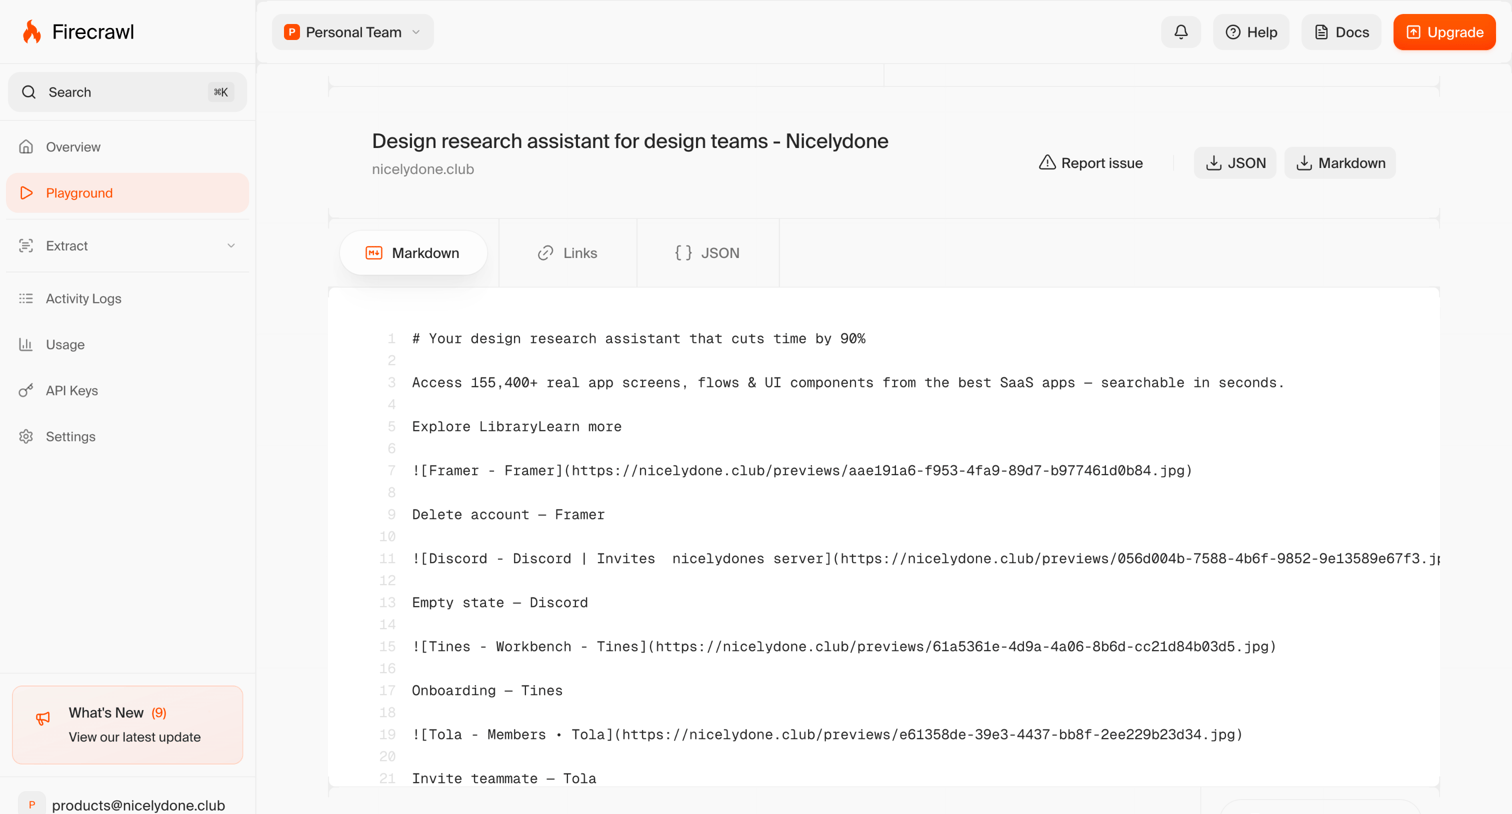

Playground view where the user reviews the markdown output of a scraped webpage alongside options to download the result as JSON or report an issue.
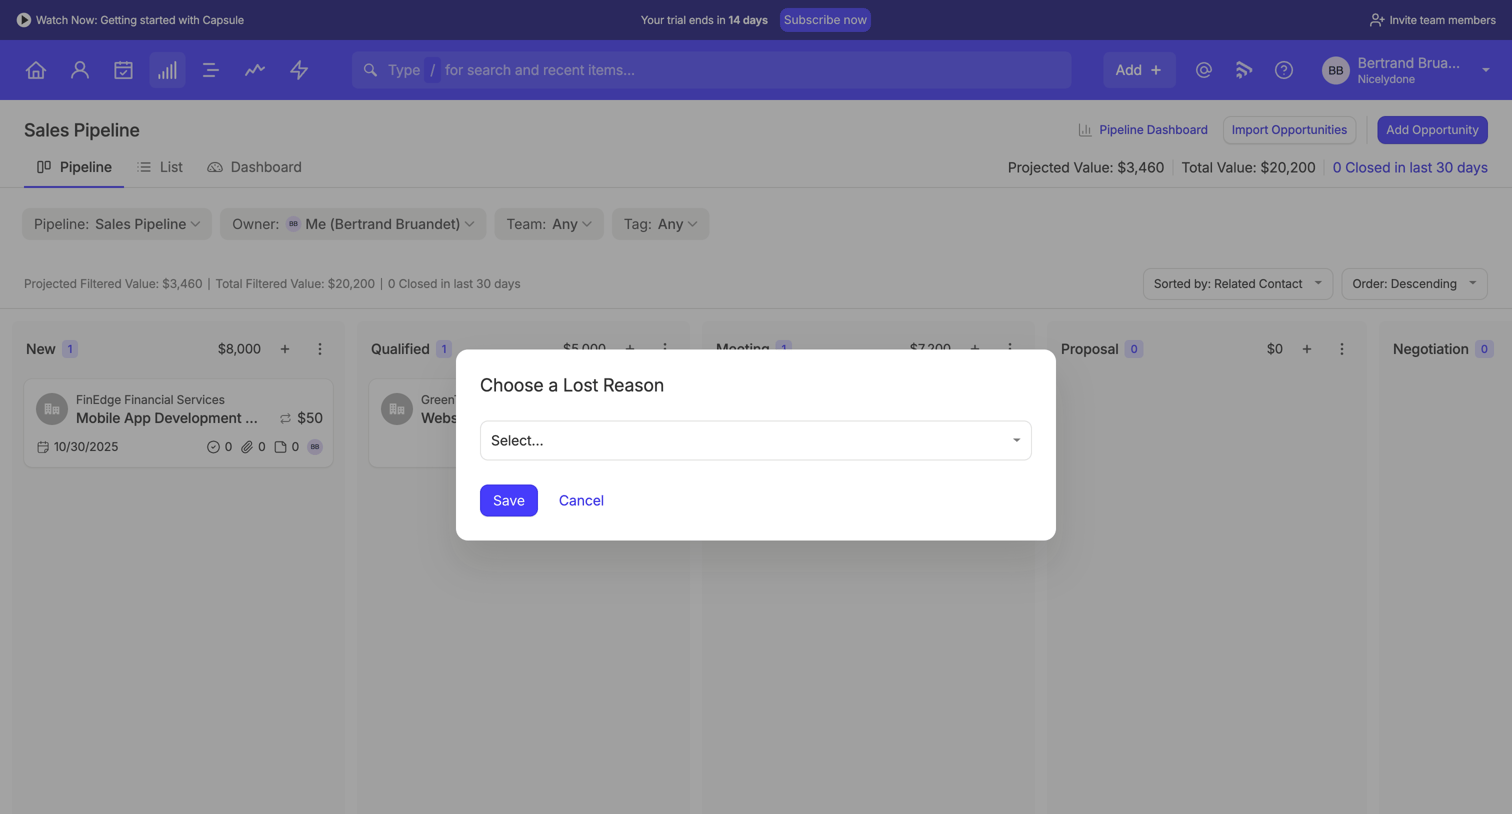

Sales pipeline kanban board where the user is prompted to choose a specific reason for marking an opportunity as lost.
Explore the full SaaS screen library
Upgrade to unlock the full library.
Trusted by the best teams








About Report
See how apps let people flag content, accounts, or problems for review. Explore how reporting forms ask for a reason and explain the next action.