API analytics screen examples
API analytics screen design examples from SaaS apps. Browse examples from Inference, Elevenlabs, Llamaindex.
Explore the examples
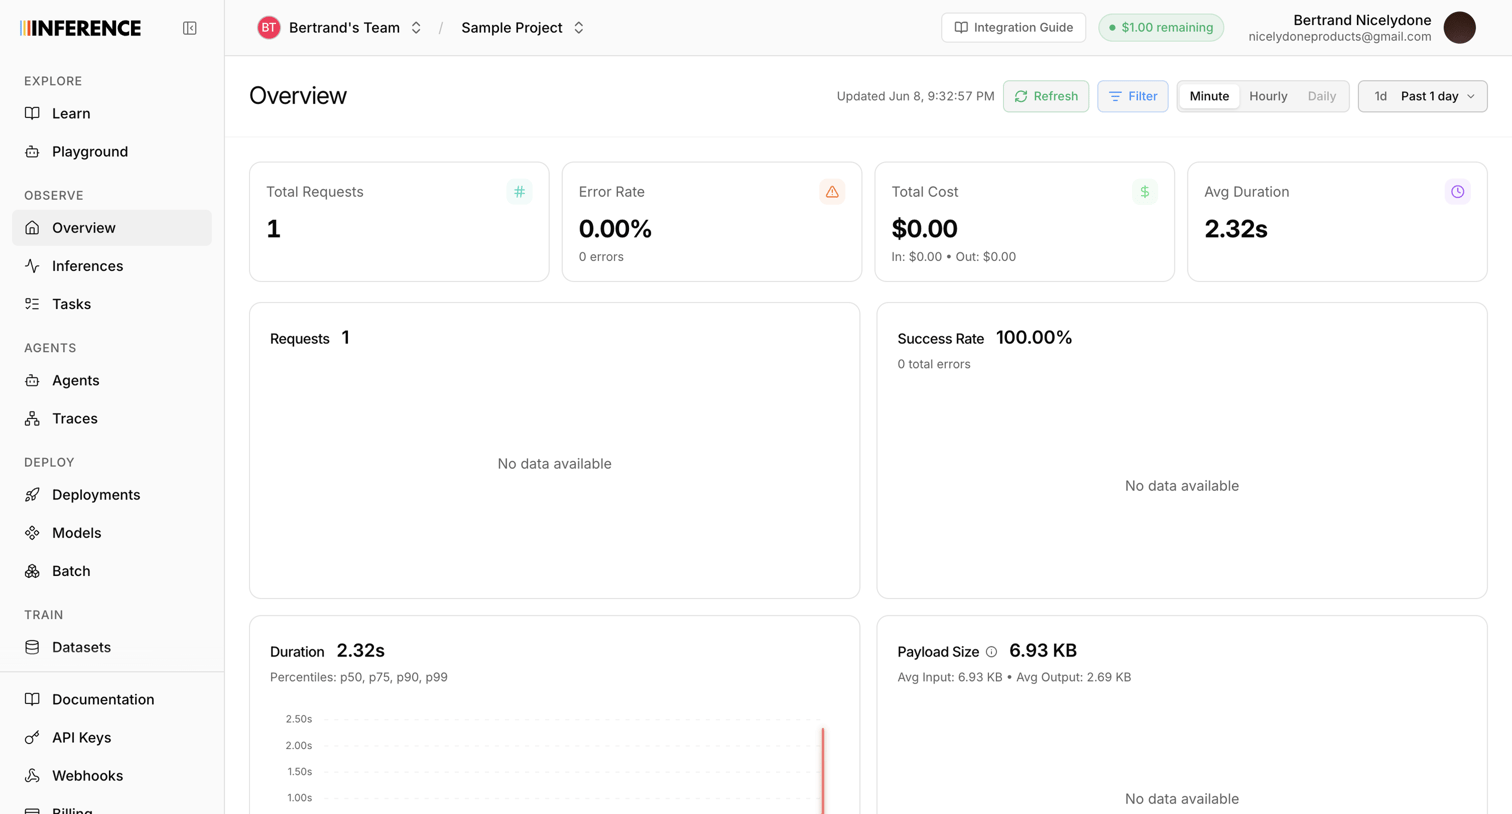

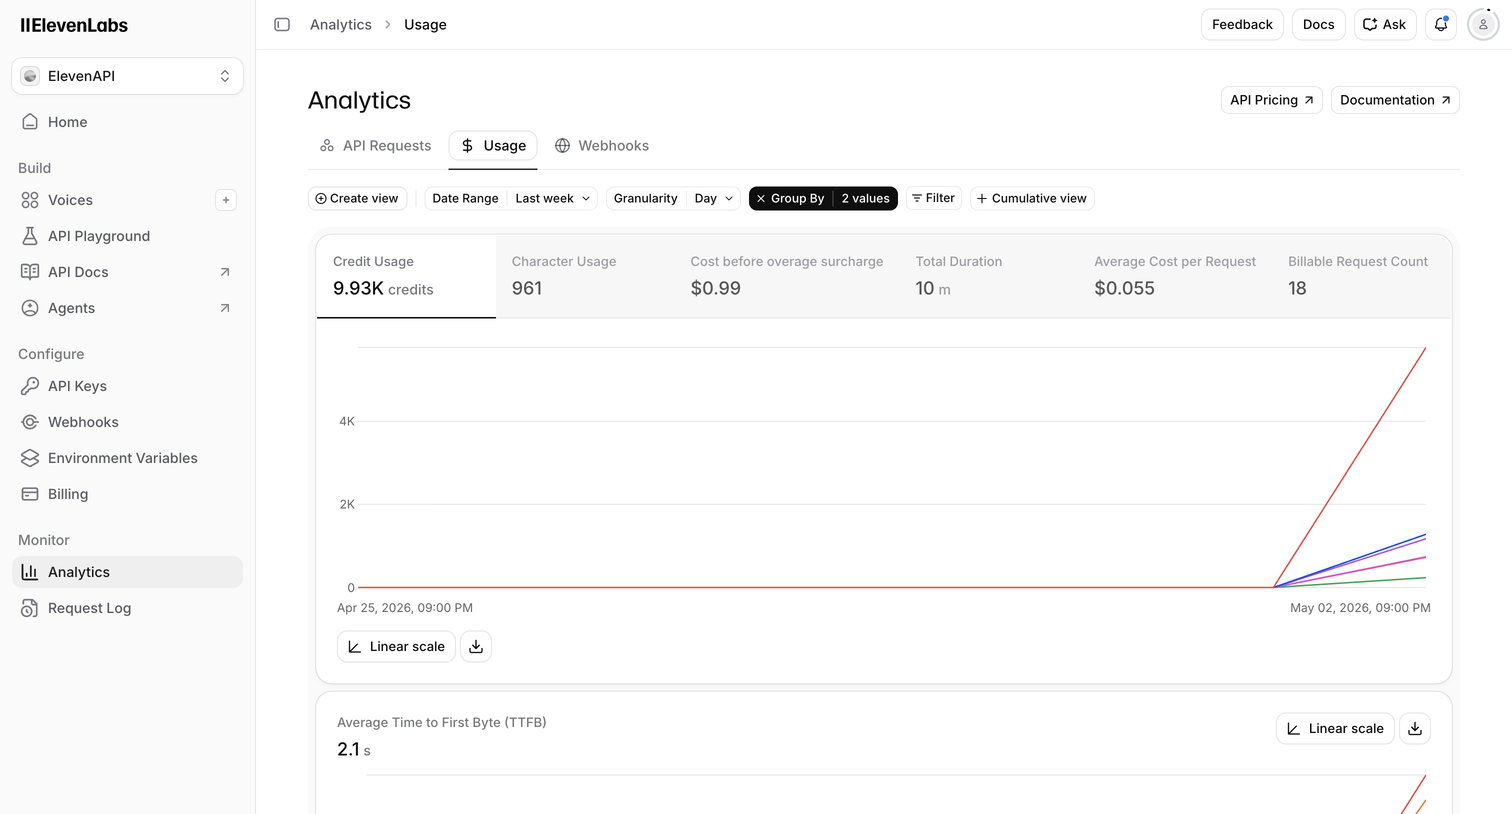

Dashboard where the user monitors API usage metrics like credit consumption, character count, and request costs over time.
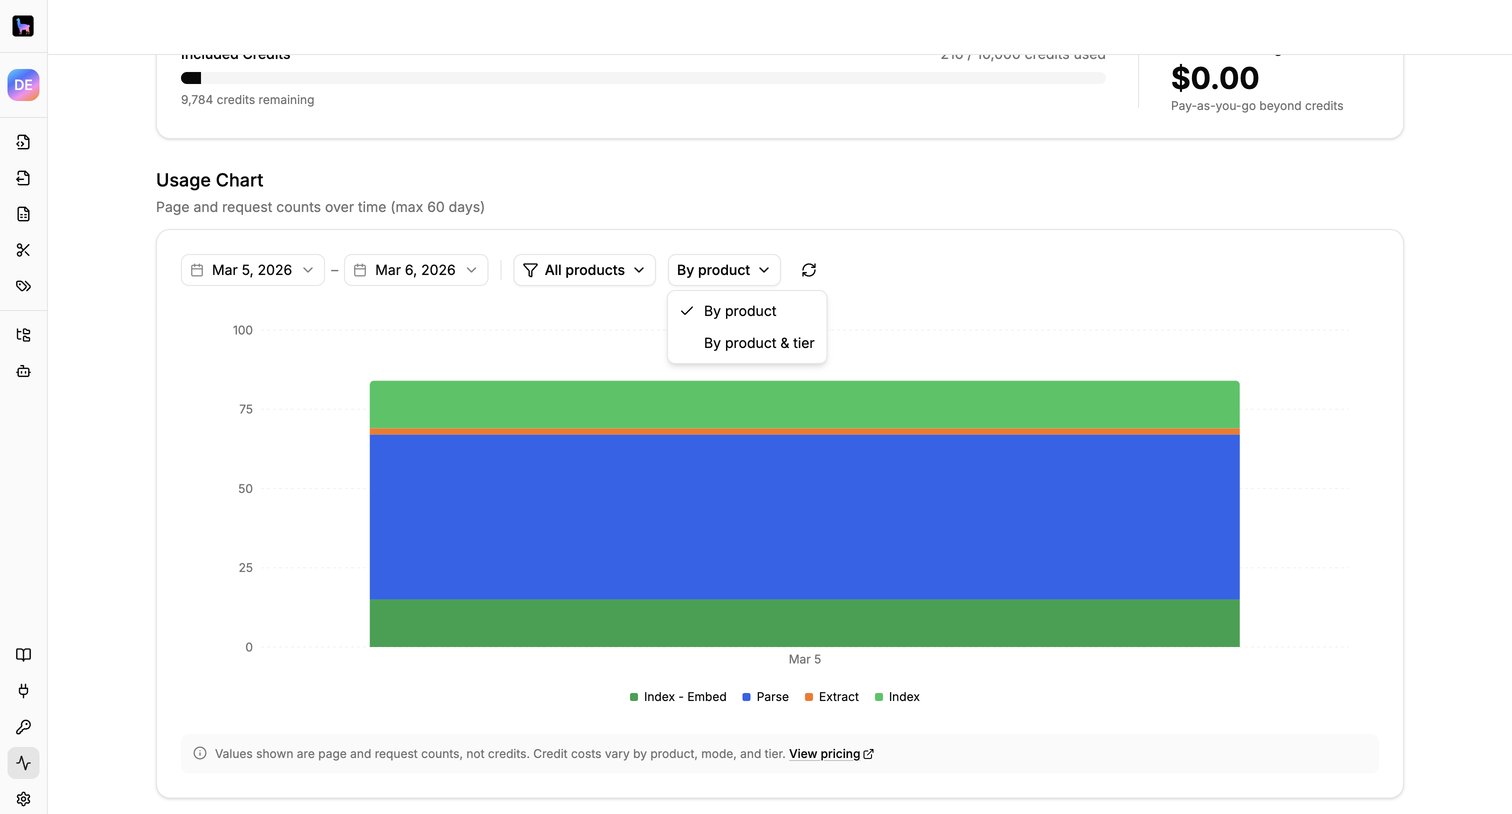

Settings page where the user views their organization's credit usage and a stacked bar chart of page and request counts filtered by product over time.
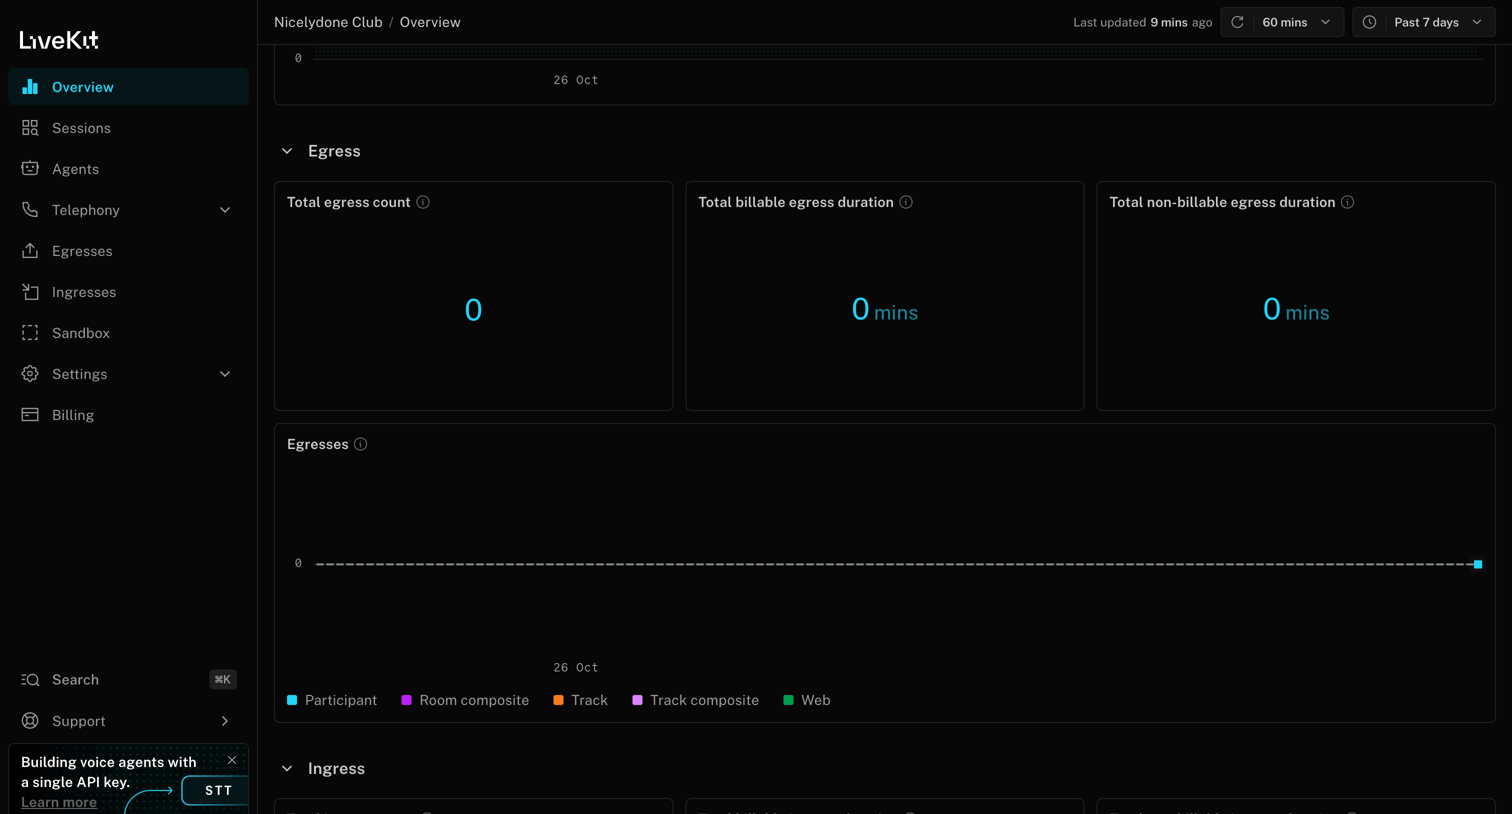

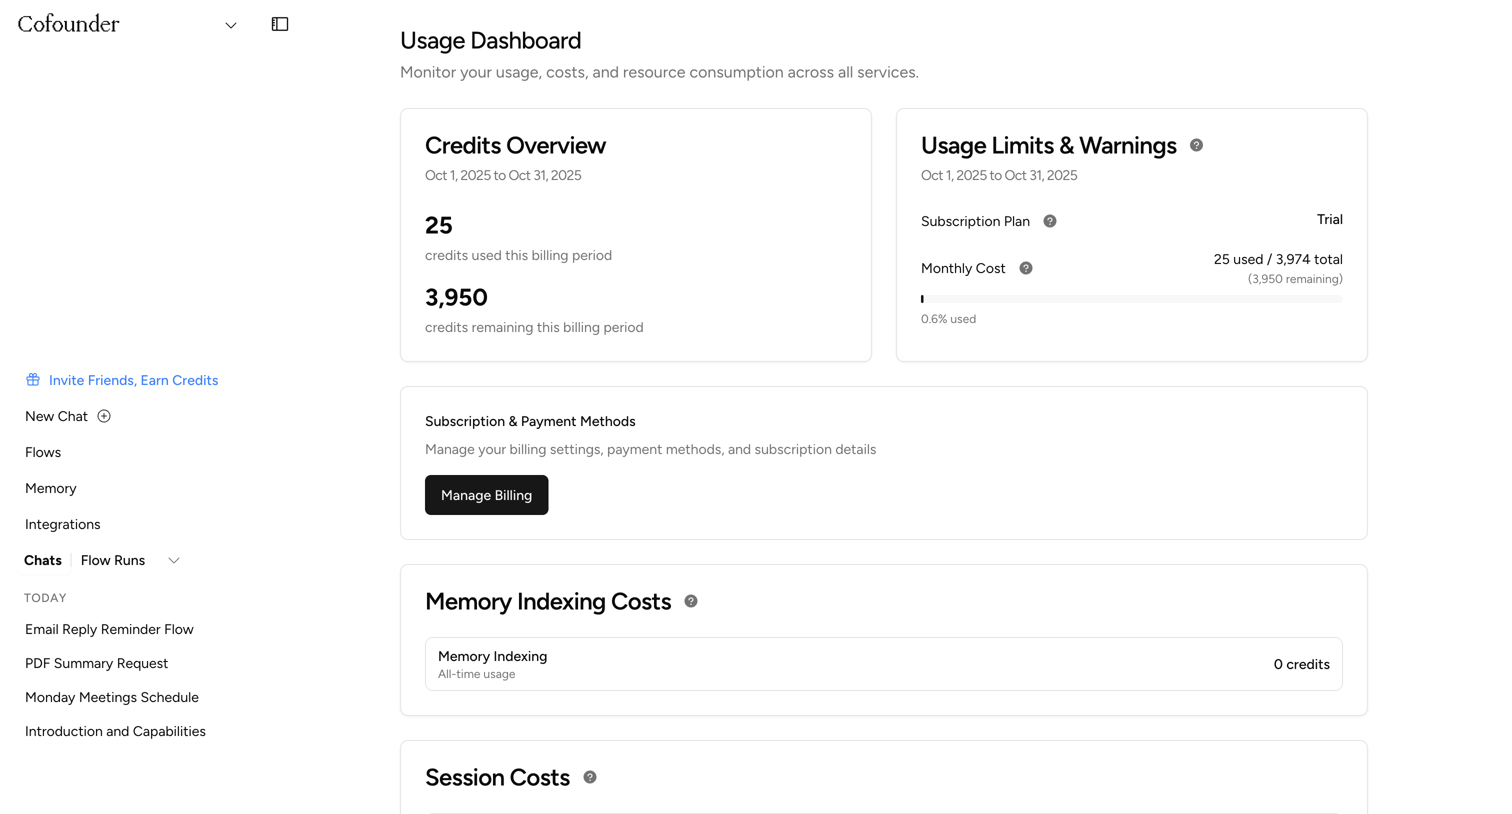

Settings page where the user monitors their credit usage, subscription limits, session costs, and token consumption across services.
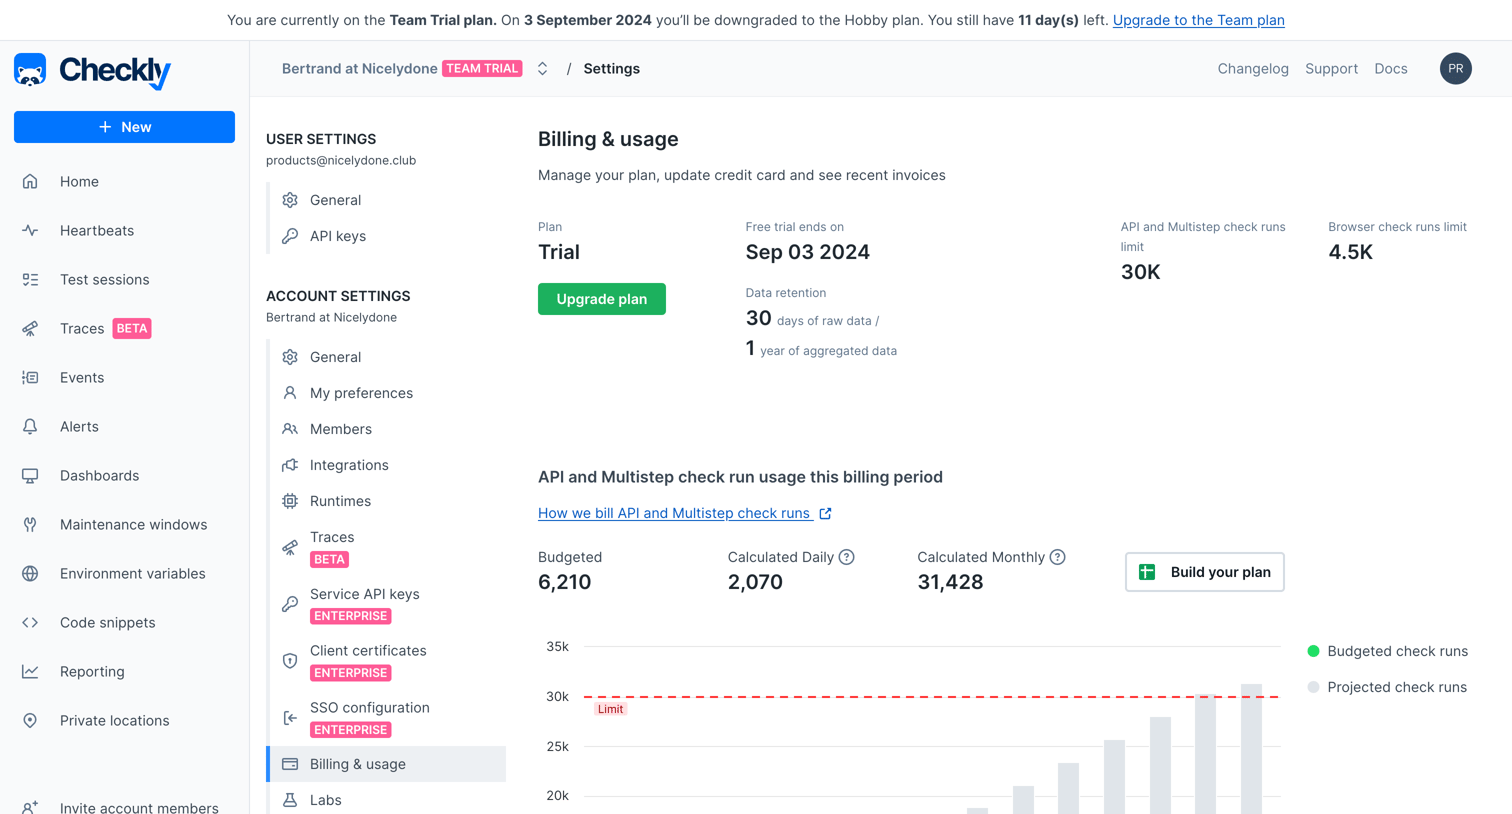

Settings page where the user views their current trial plan limits, tracks API and browser check run usage via bar charts, and reviews invoice history.
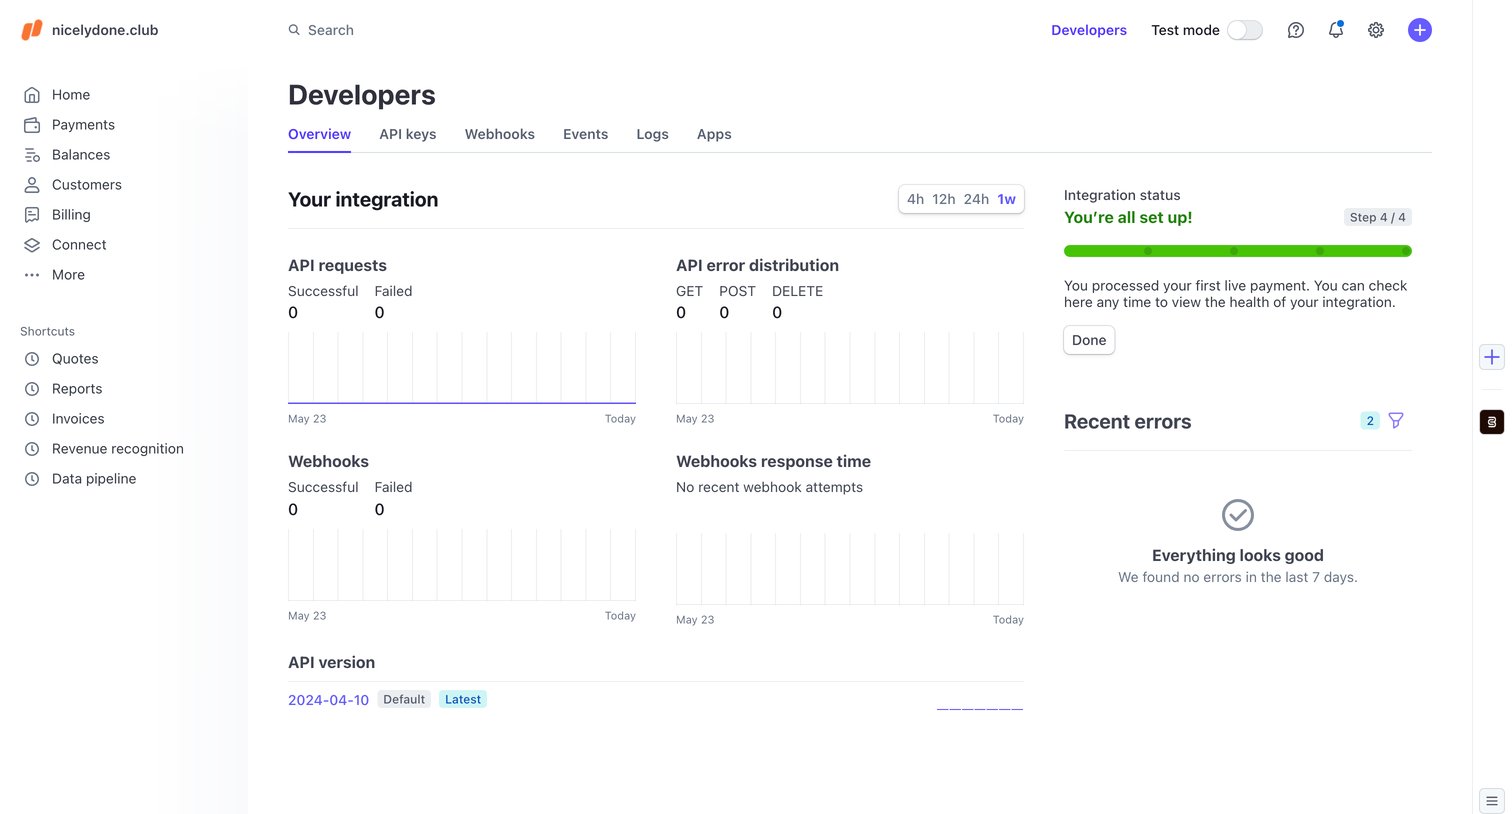

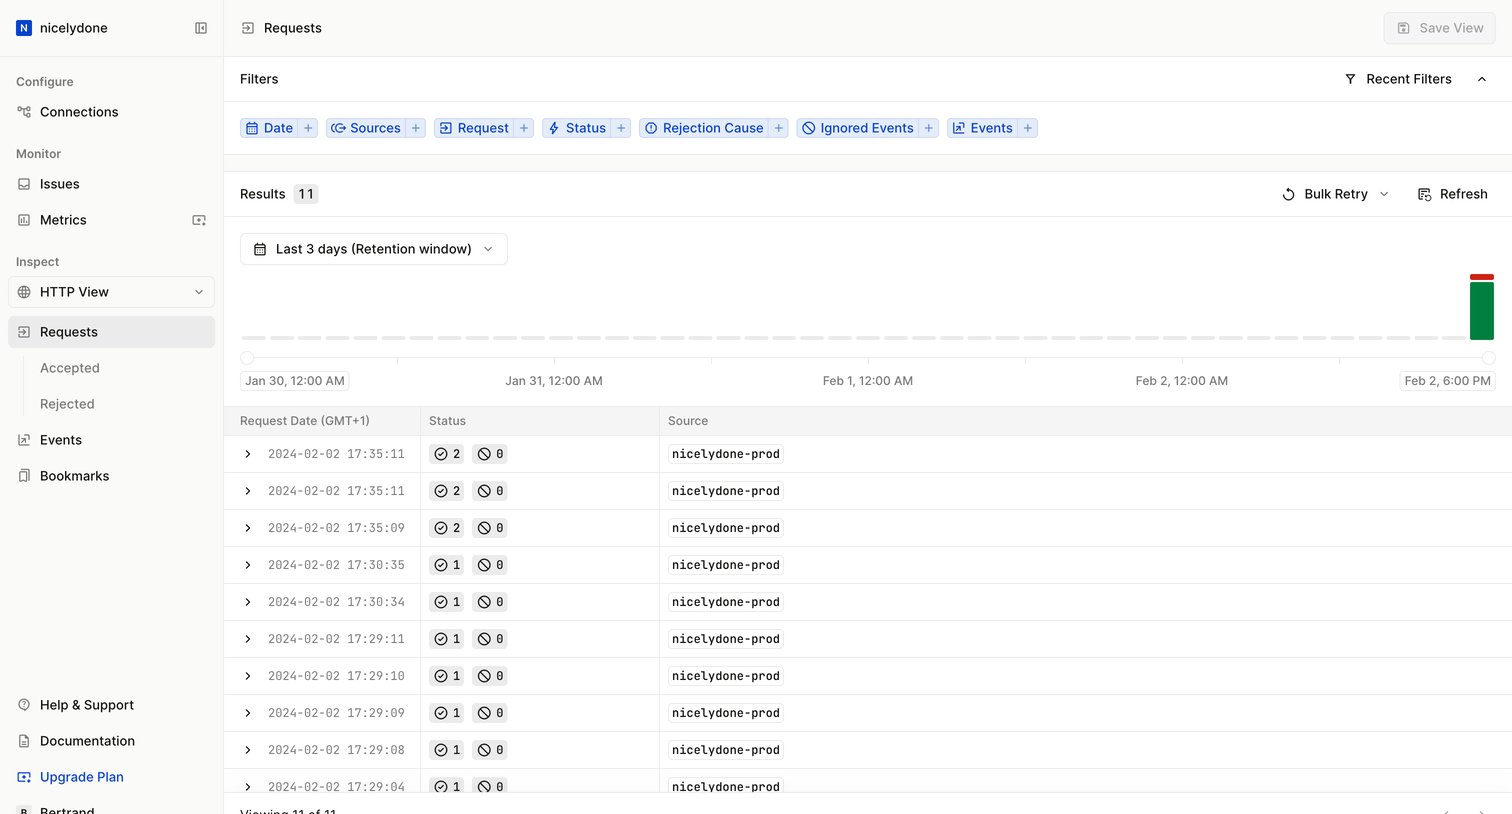

List view where the user monitors webhook requests, filters by date and status, and views a volume timeline.
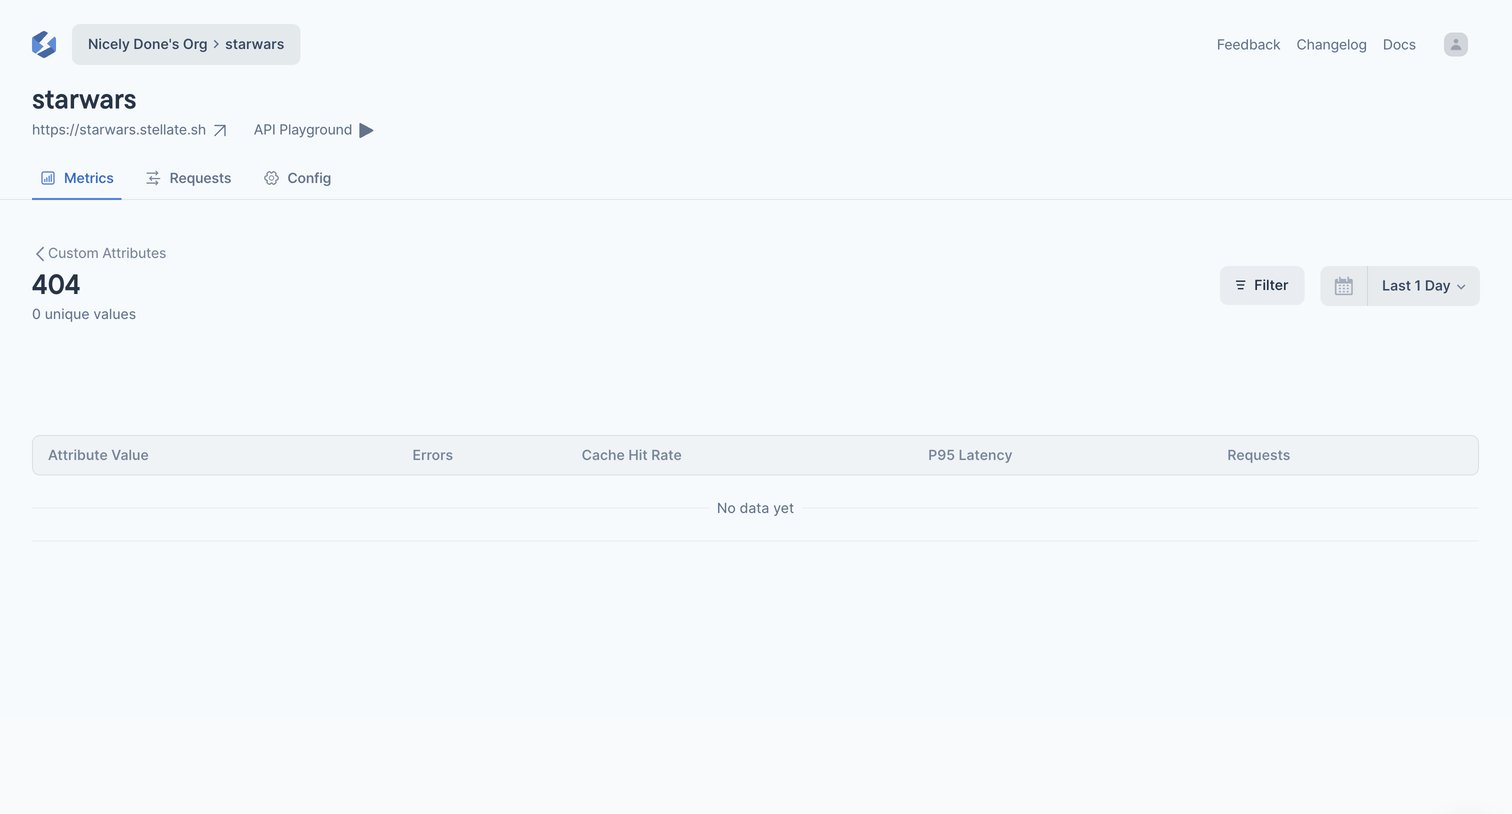

Metrics list view showing custom attributes for a specific service, currently in an empty state with no data available.
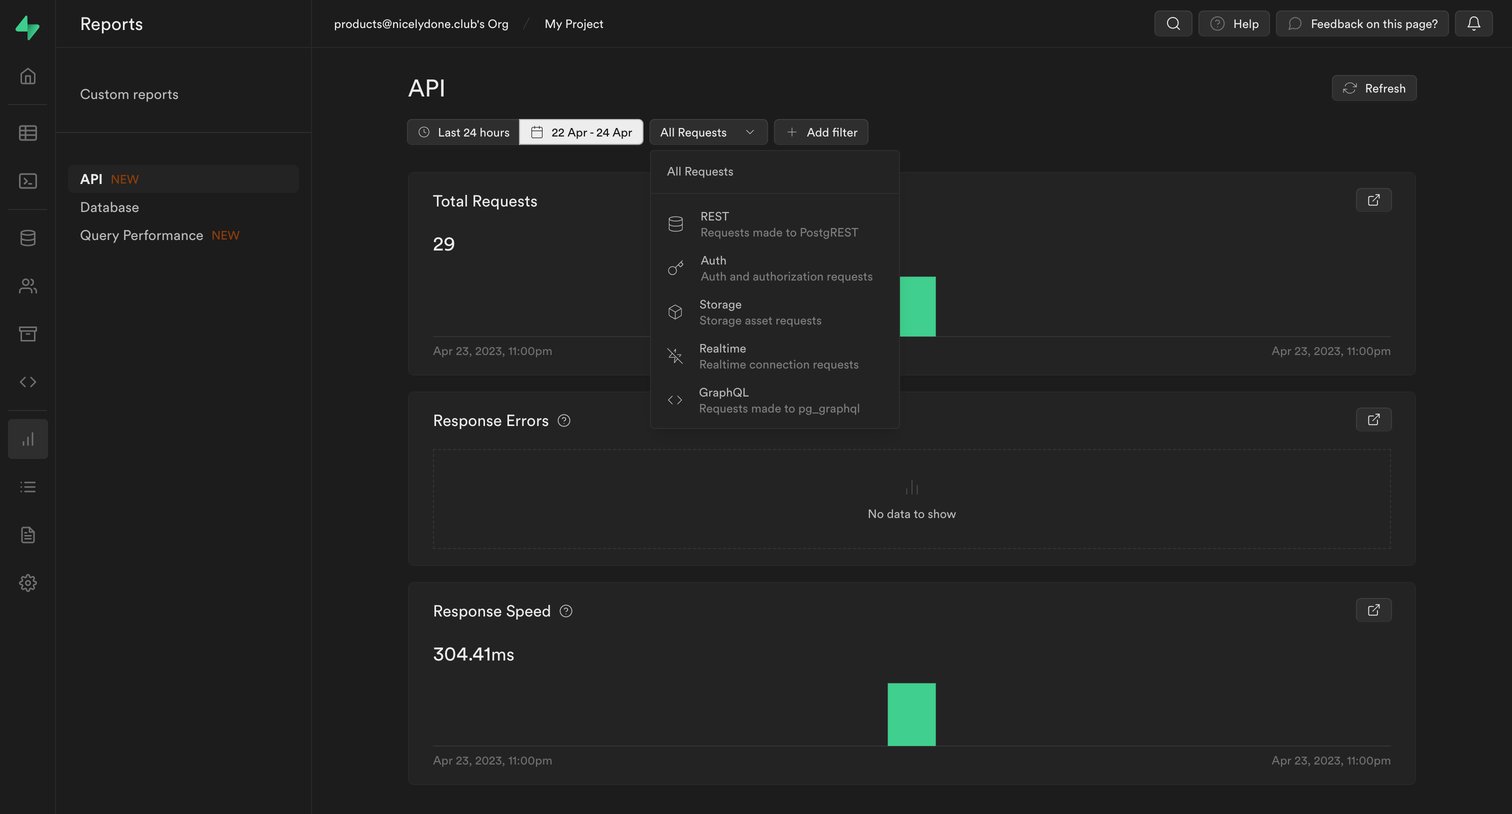

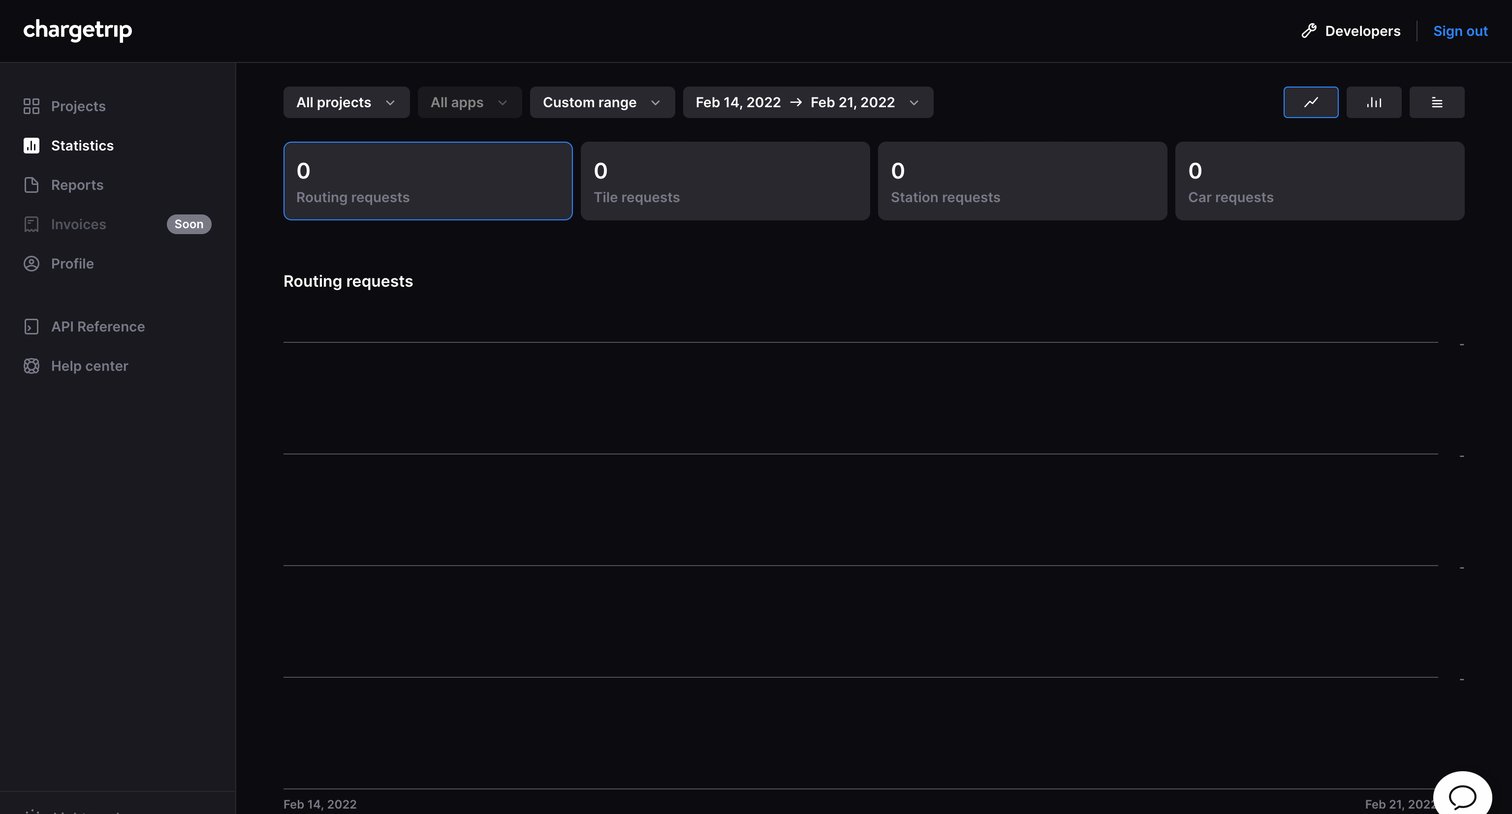

Dashboard showing API usage statistics with an empty state for routing requests over a selected date range.
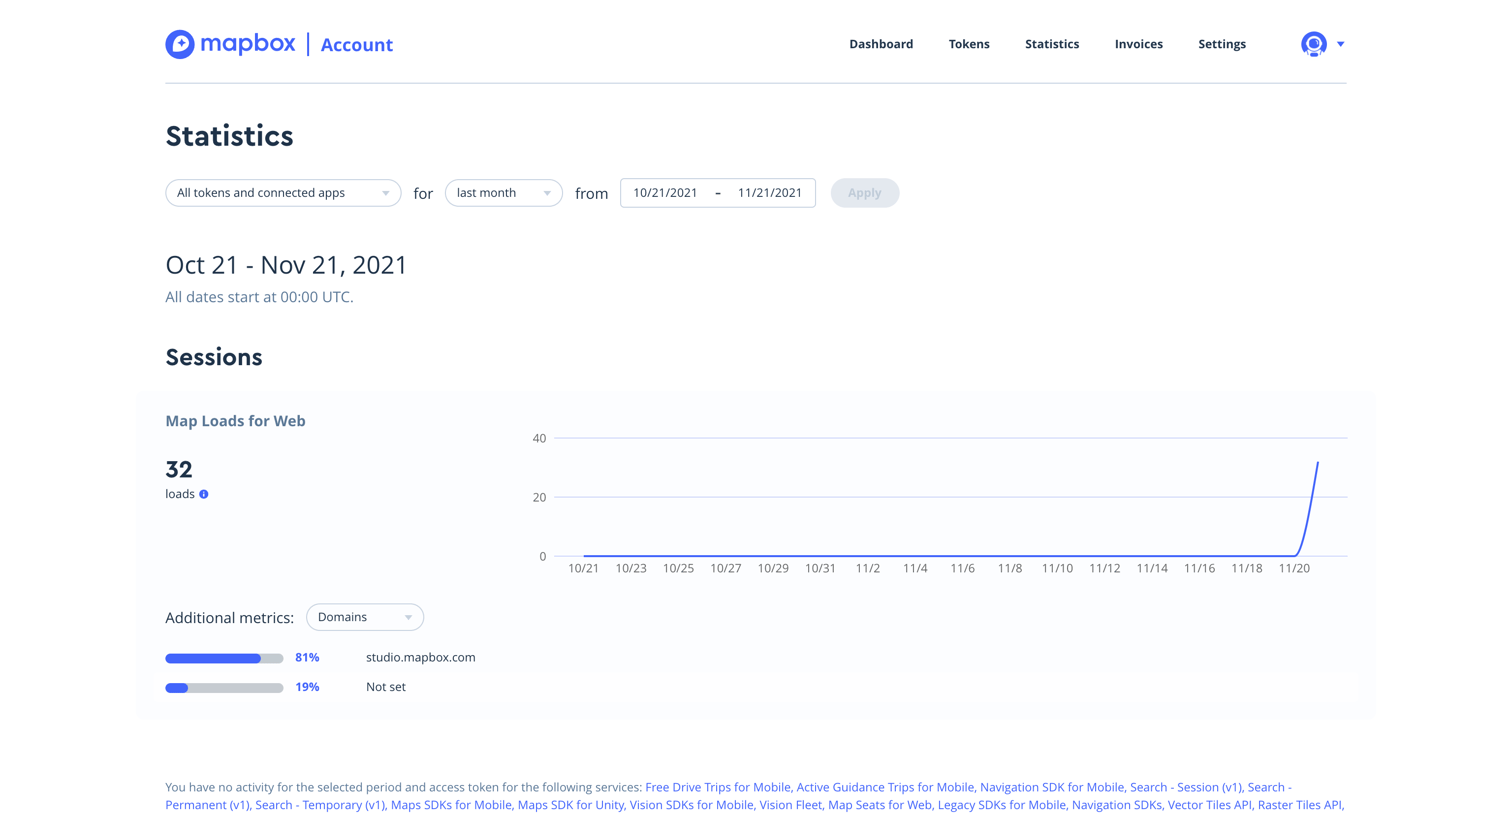

Explore the full SaaS screen library
Upgrade to unlock the full library.
Trusted by the best teams







