Skip to content

Stats screen examples

Stats screen design examples from SaaS apps. Explore how SaaS apps make numerical information the focus of a screen. Look at how metric labels, time periods, and comparison values give meaning to the…

Explore the examples
Polar - Overview | Nicelydone | Polar screen
Polar logo
Polar

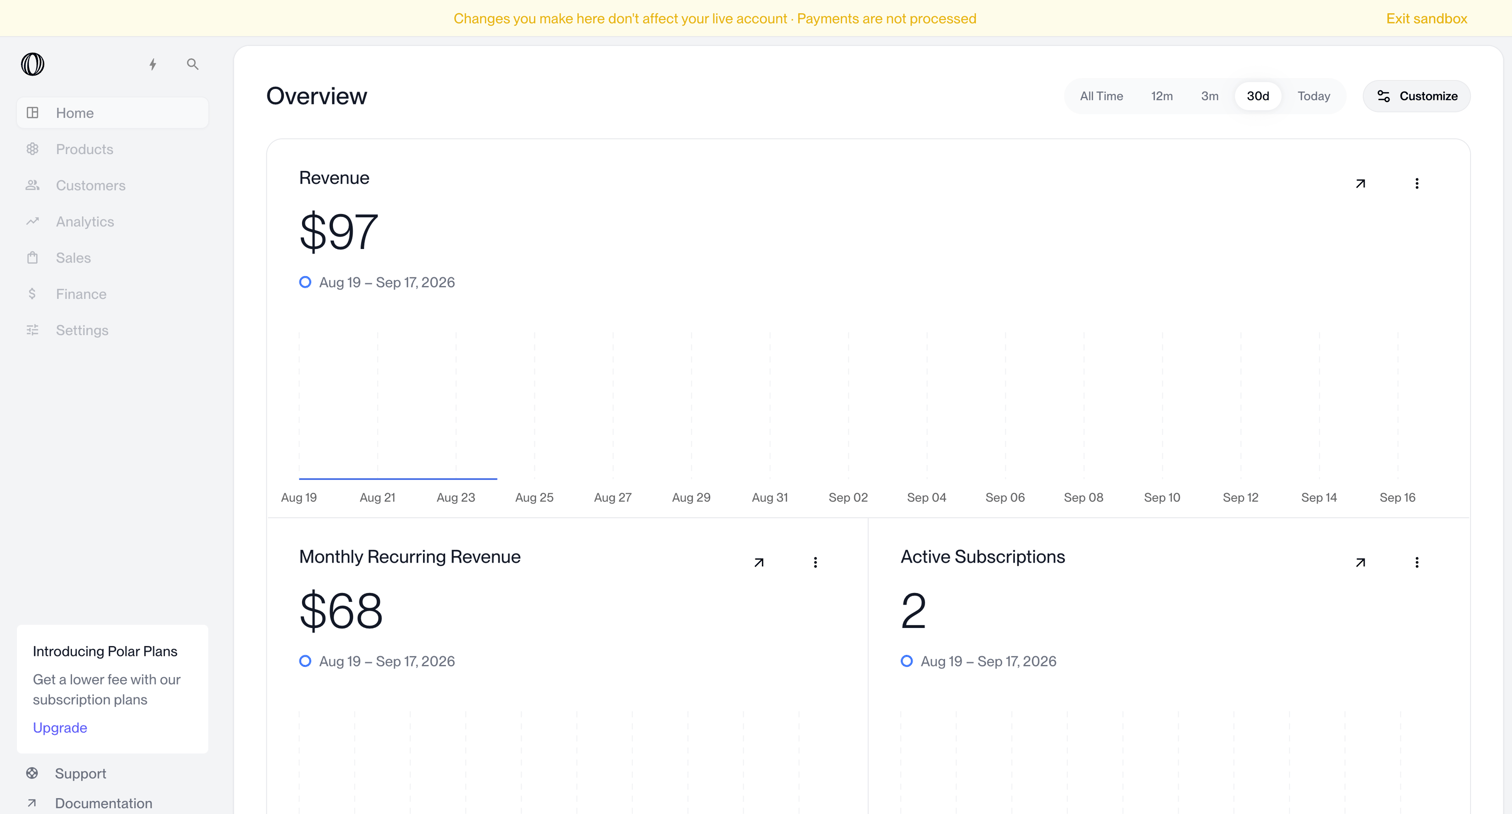
Dashboard overview displaying revenue, monthly recurring revenue, and active subscriptions charts with a time range selector in a sandbox environment.

Inference - Dashboard | inference.net screen
Inference logo
Inference

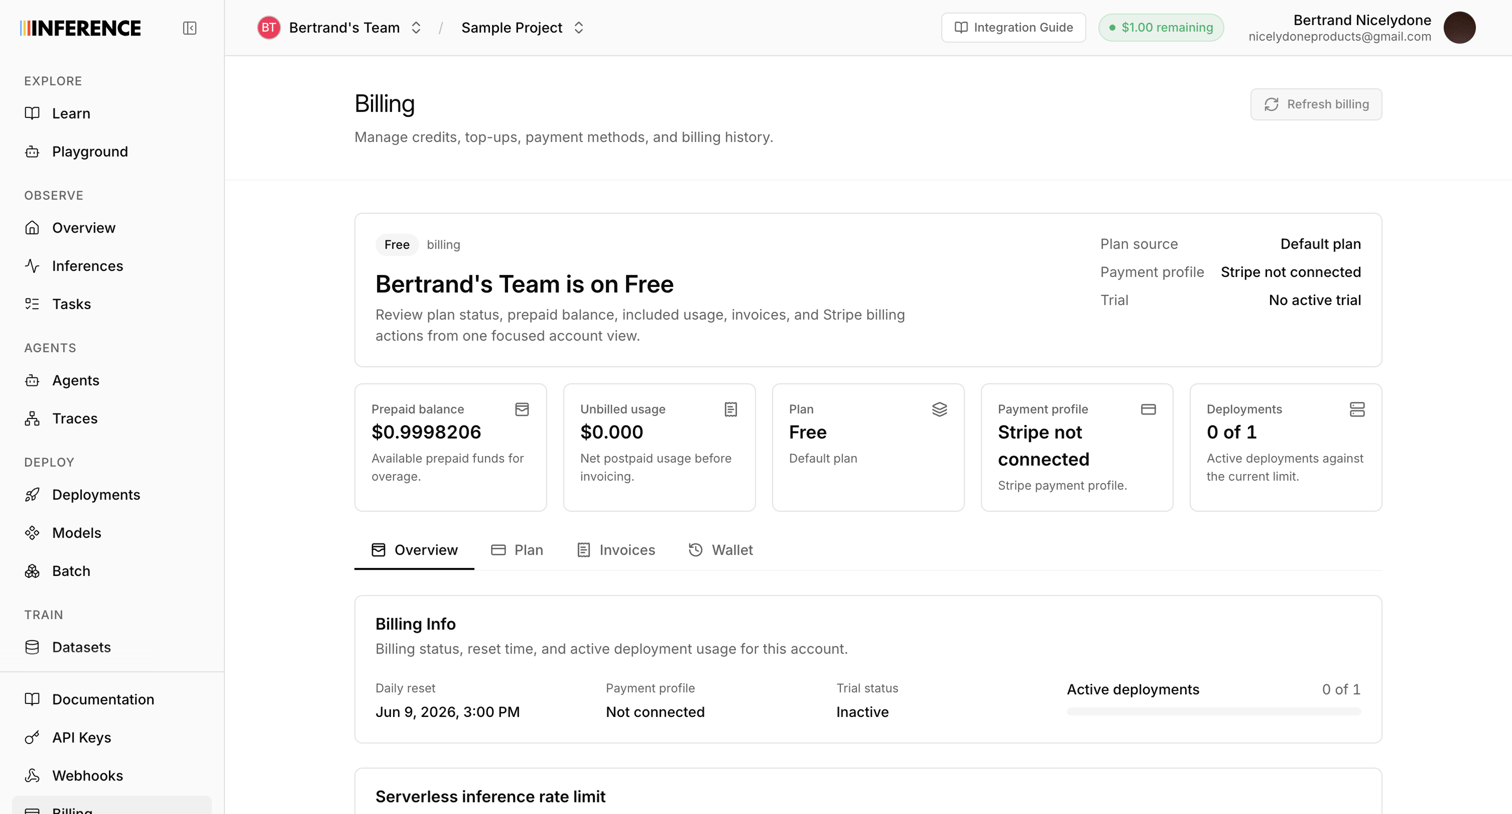
Settings page where the user views their current free plan status, prepaid balance, unbilled usage, and serverless inference rate limits.

Origin Financial screen
Origin Financial logo
Origin Financial

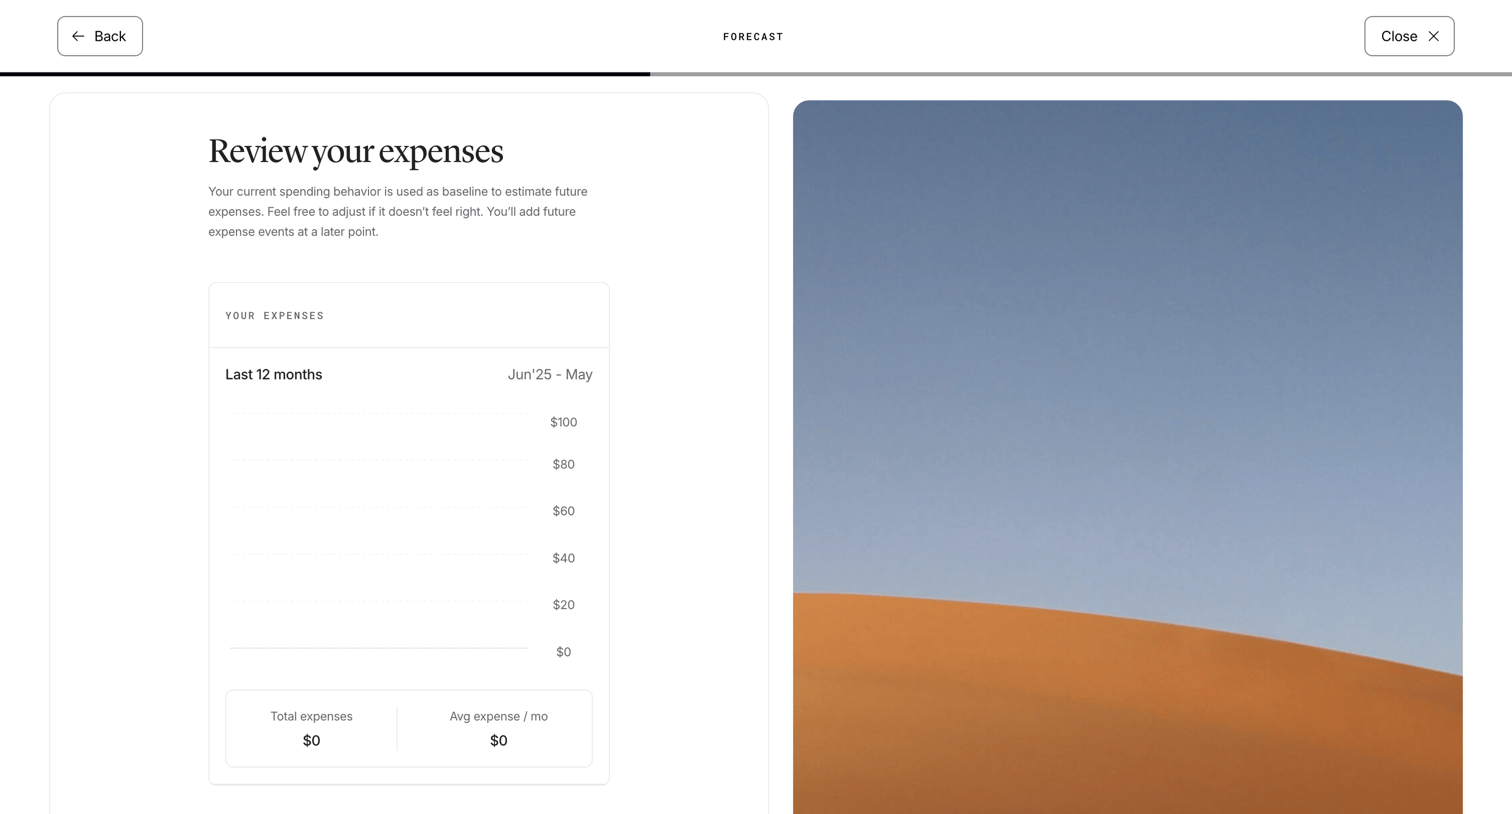
Onboarding step where the user reviews their estimated future expenses based on past behavior and can manually adjust their monthly expense amount.

Steel - Steel | Open-source Headless Browser API screen
Steel logo
Steel

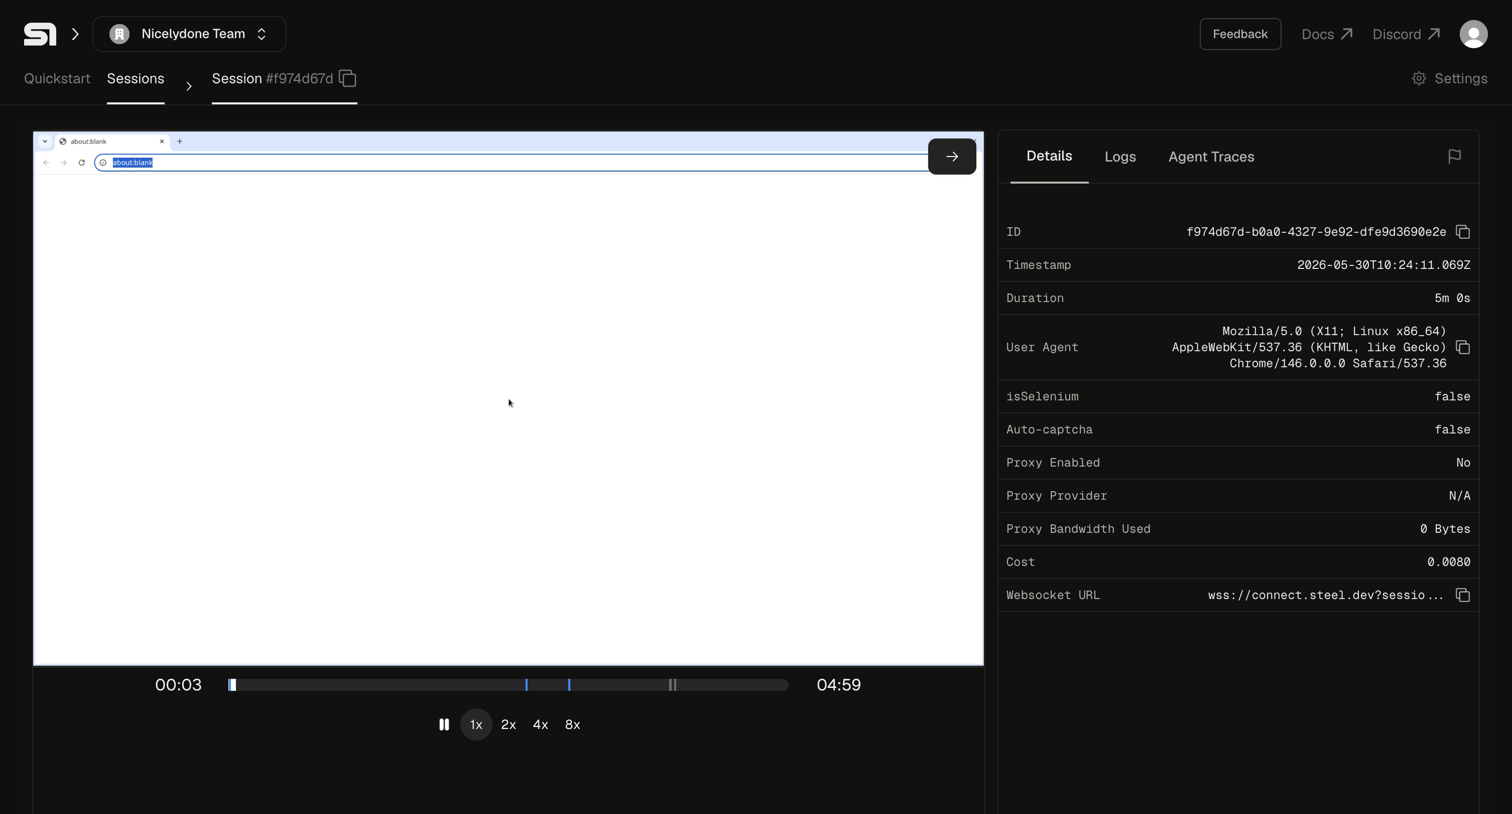
Detail page where the user watches a recorded browser session replay and reviews its technical metadata like user agent, duration, and cost.
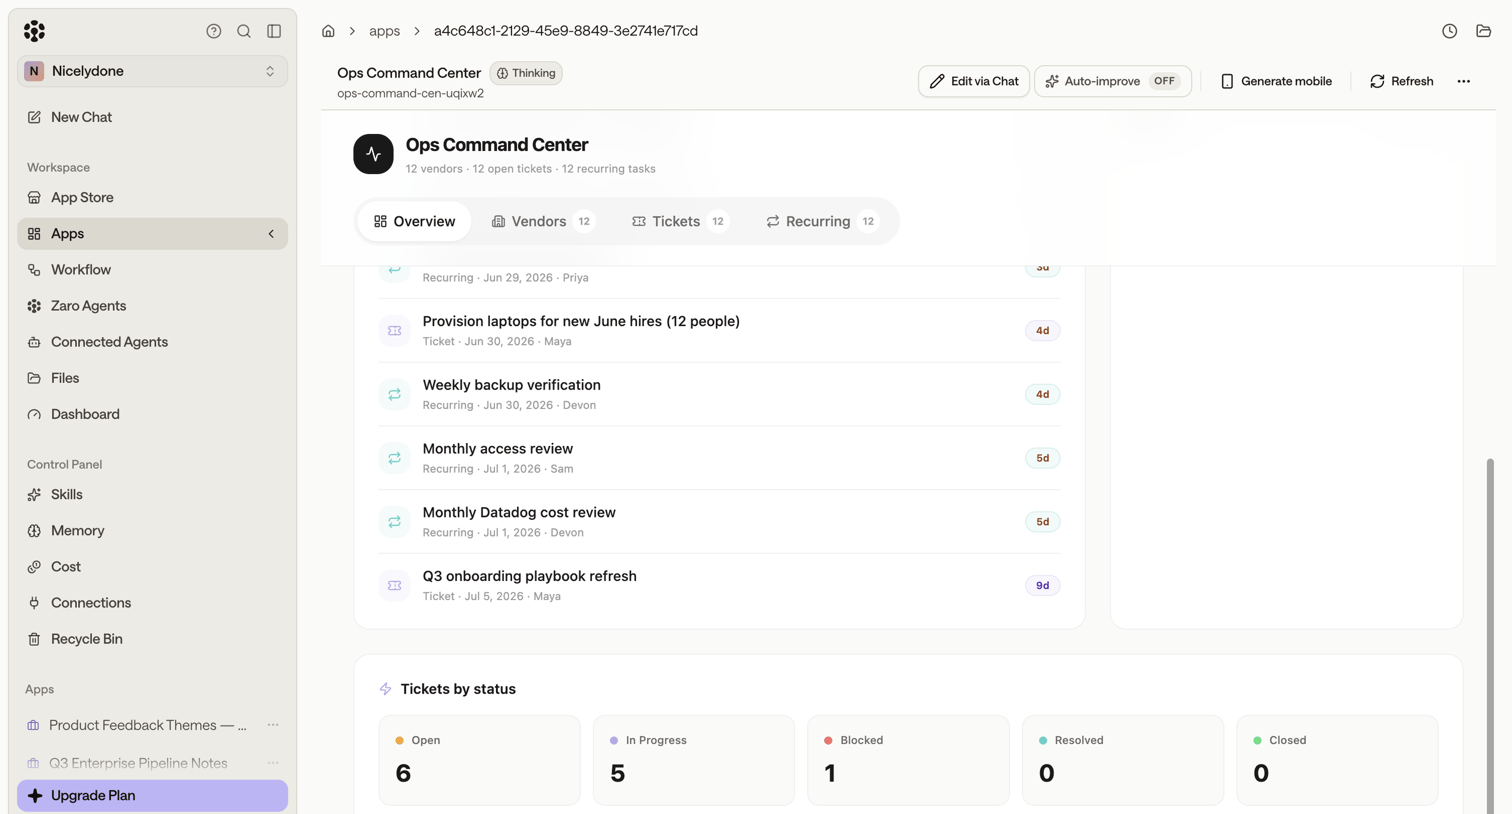

Zaro - Zaro - The Context Layer for Enterprise AI screen
Zaro logo
Zaro

Detail page for a custom app called Ops Command Center, displaying a list of recent tickets and a breakdown of tickets by status.

Axiom - GeneratedDash | Dashboards screen
Axiom logo
Axiom

Dashboard displaying tracing and HTTP request metrics over time, including average trace duration, total trace count, and status codes.

Extend - extend screen
Extend logo
Extend

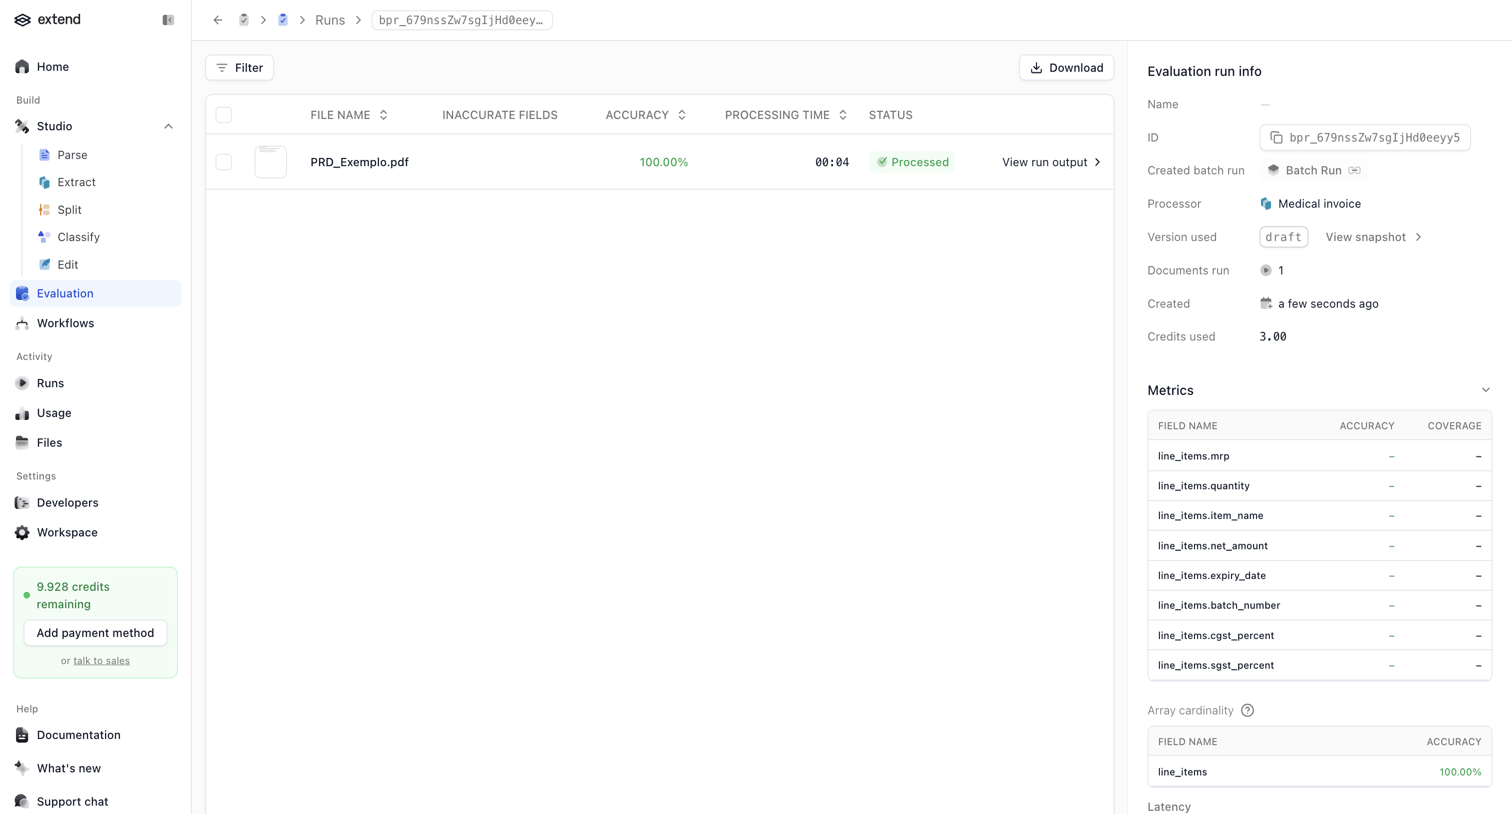
Detail page where the user reviews the accuracy, latency, and field-level metrics of a specific AI evaluation run on a medical invoice document.

Lithic - Lithic - Create Tokenization Rule screen
Lithic logo
Lithic

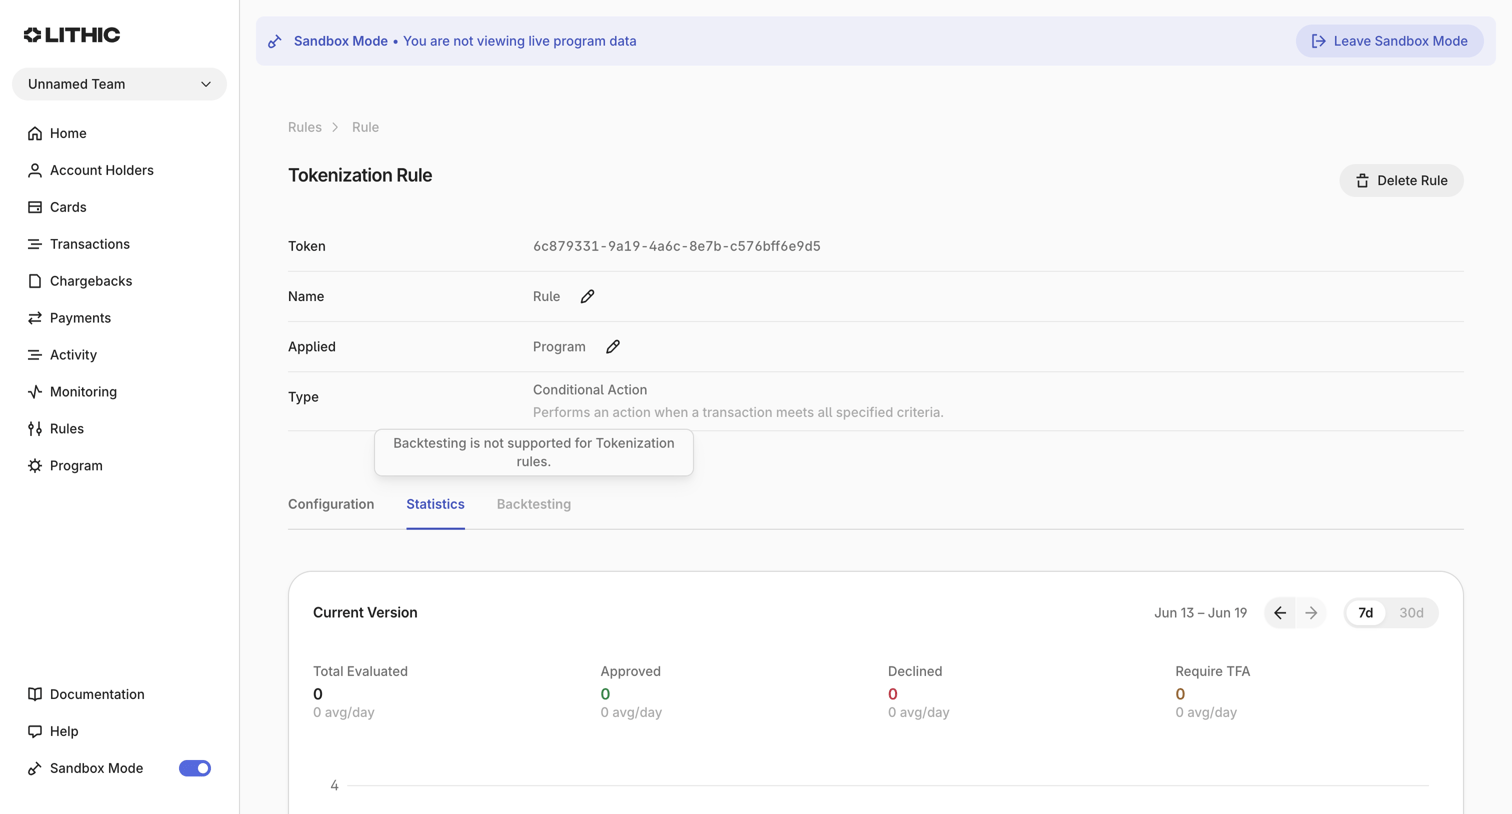
Detail page for a specific tokenization rule showing its configuration, evaluation statistics, and an option to delete it.
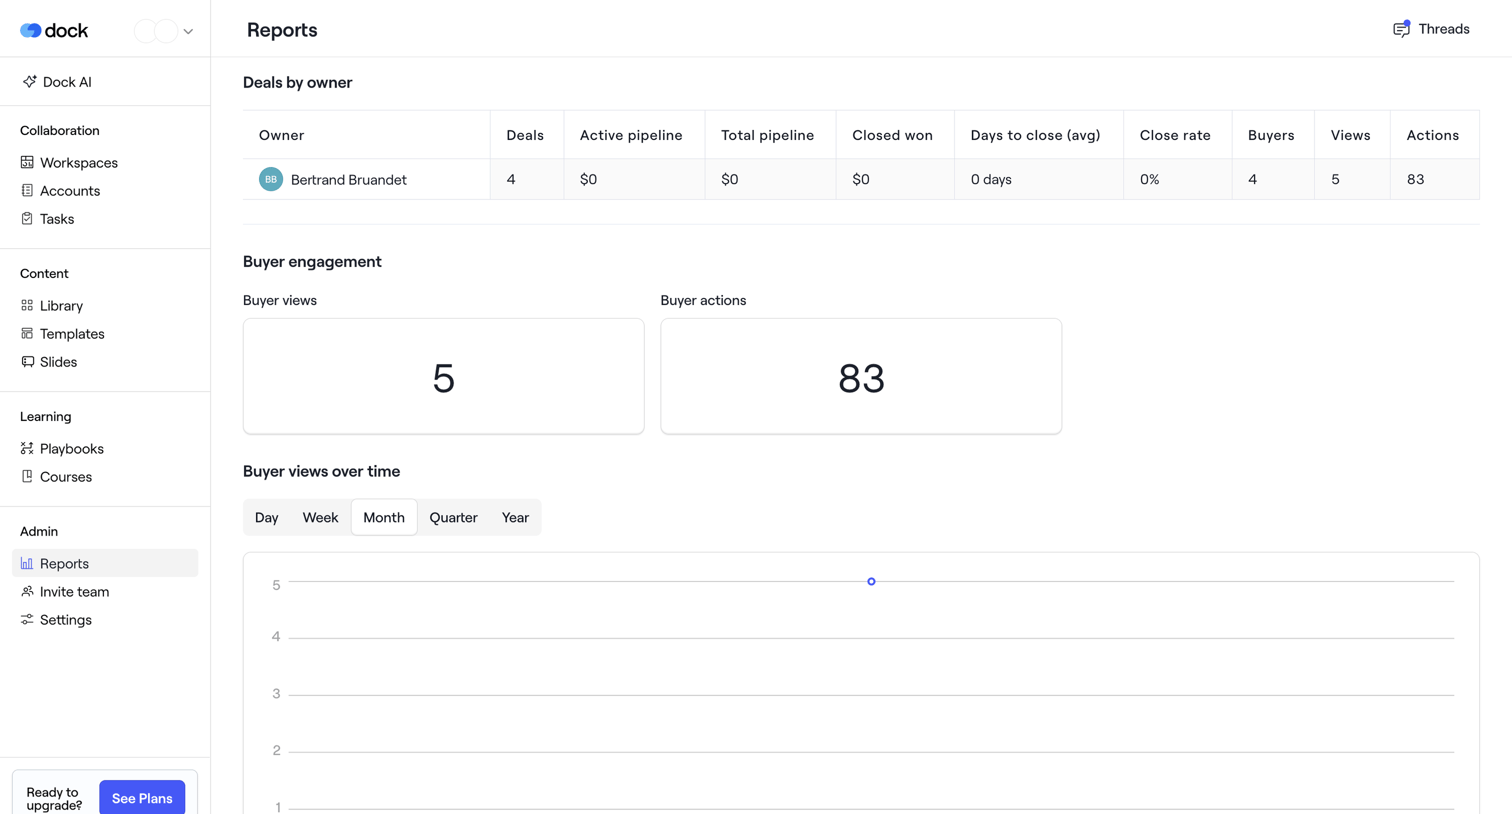

Dock - Reports · Dock screen
Dock logo
Dock

Dashboard for admin users displaying sales reports, including a deals by owner table, buyer engagement KPIs, and a views over time chart.

Appwrite - Webhook - Appwrite screen
Appwrite logo
Appwrite

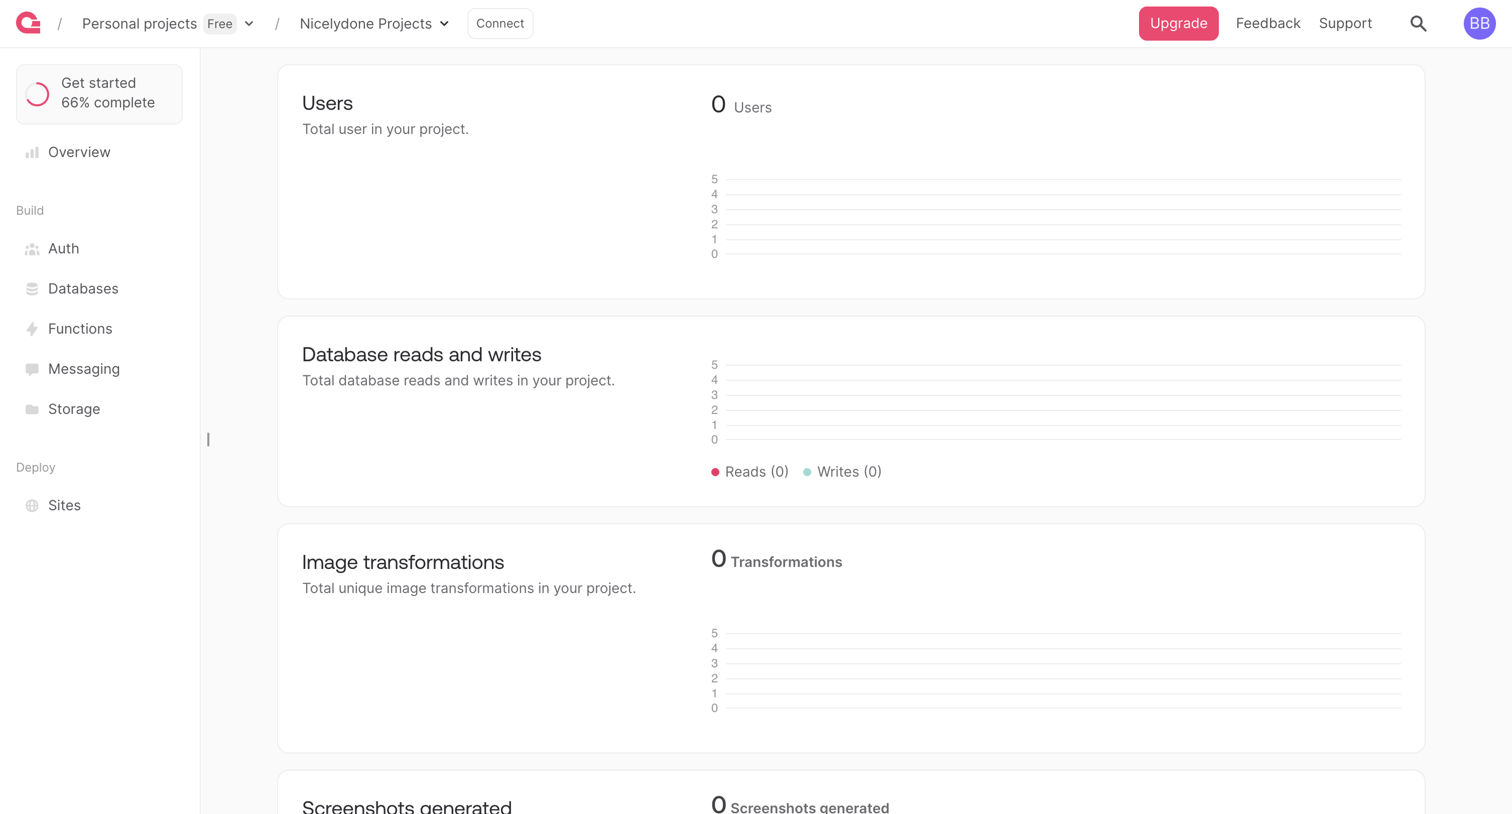
Dashboard showing aggregate usage metrics for a project, including users, database operations, and image transformations, currently displaying zero activity.

Voiceflow - My first AI agent screen
Voiceflow logo
Voiceflow

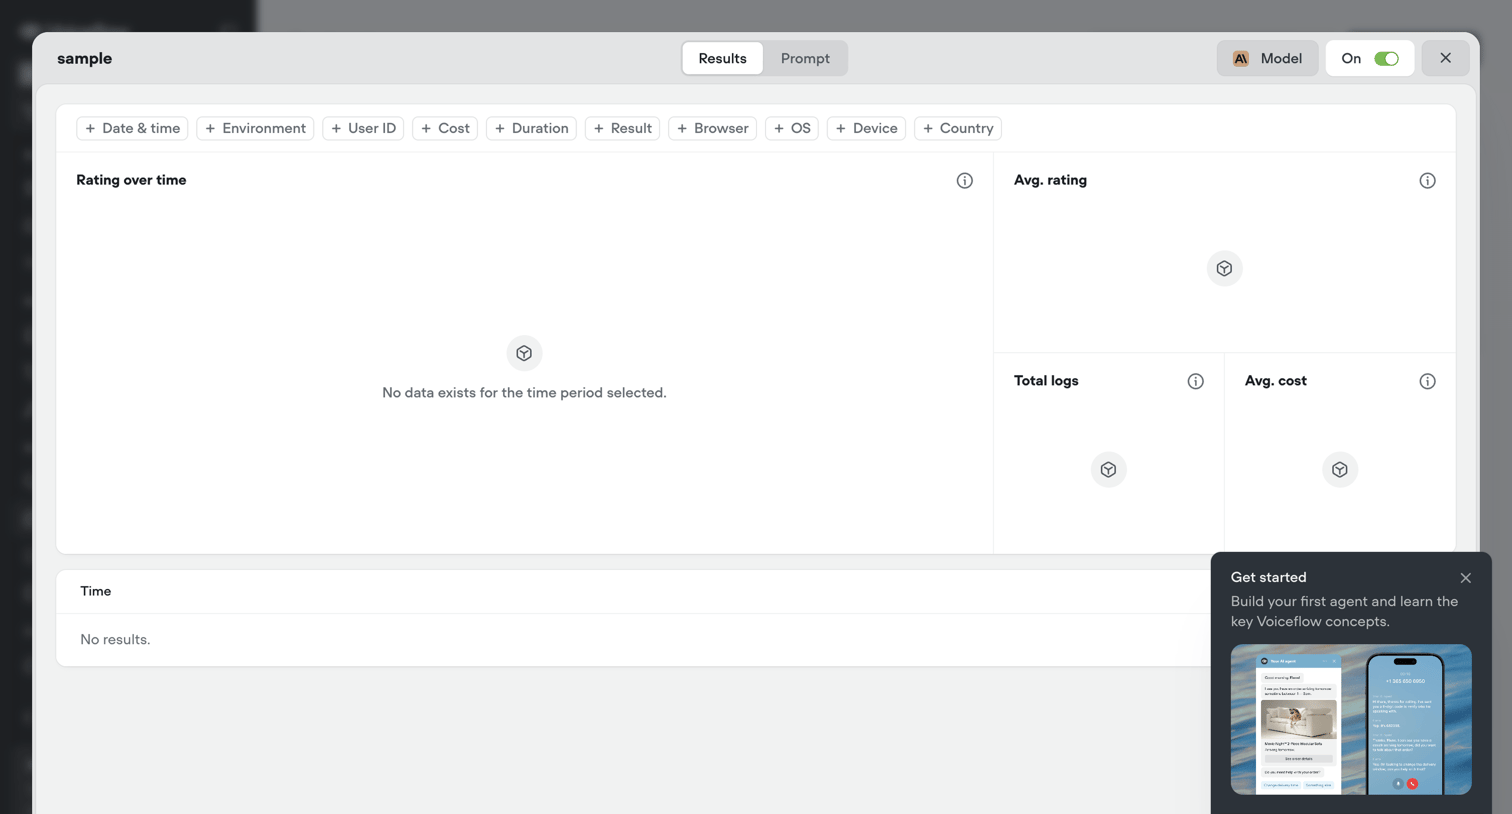
Evaluations dashboard overlay showing empty states for rating, logs, and cost metrics, along with an onboarding popover prompting the user to build their first agent.


Beside - Referral - Beside screen
Beside logo
Beside

Referral dashboard where the user tracks their earnings, copies their unique referral link, and views the reward tiers.

Explore the full SaaS screen library

Upgrade to unlock the full library.

Trusted by the best teams