Financial reporting screen examples
Financial reporting screen design examples from SaaS apps. Browse examples from Polar, Origin Financial, Found.
Explore the examples
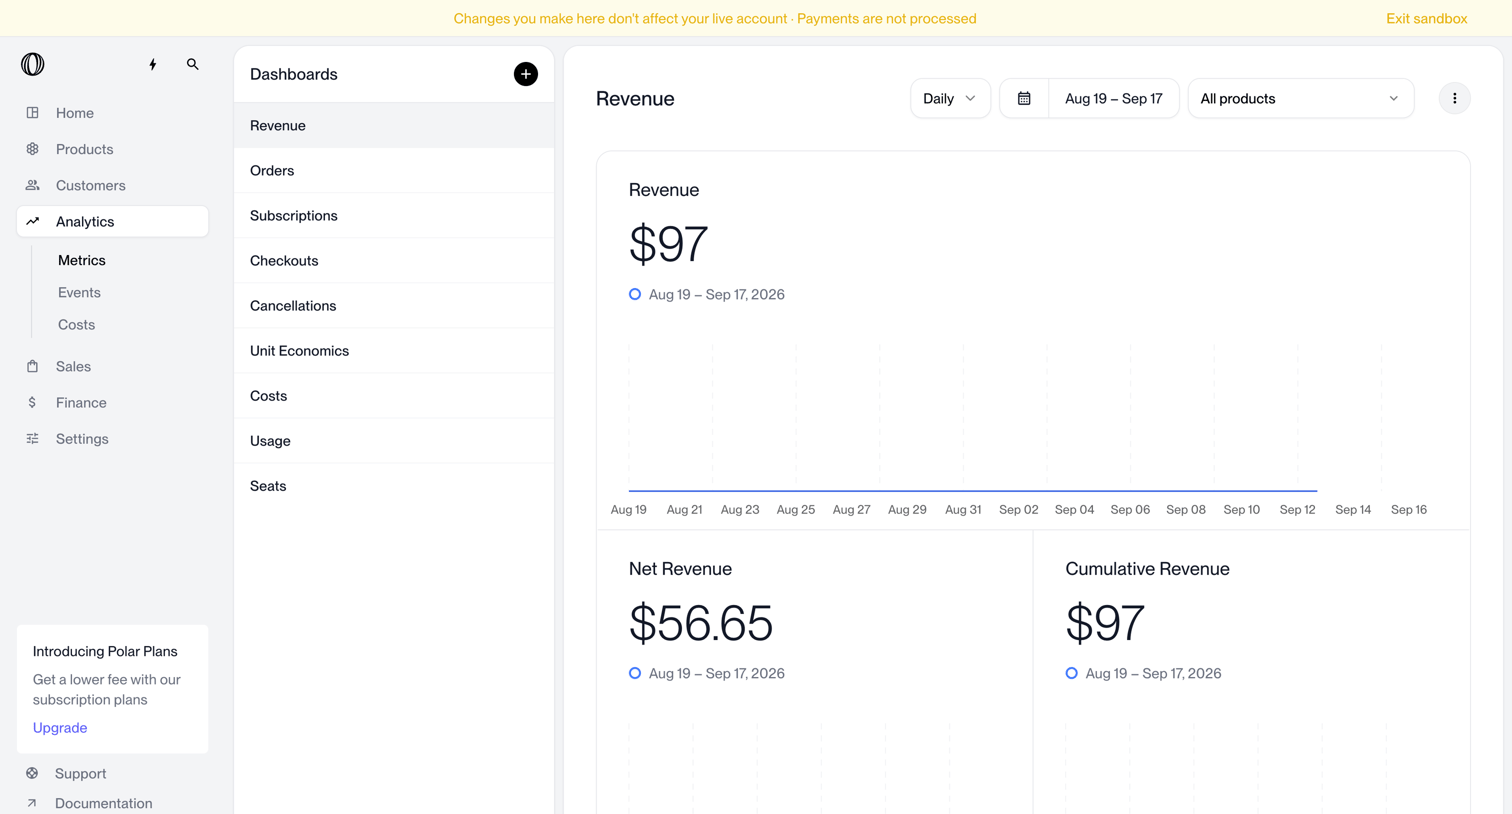

Dashboard where the user views daily revenue, net revenue, and cumulative revenue metrics filtered by date range and product.
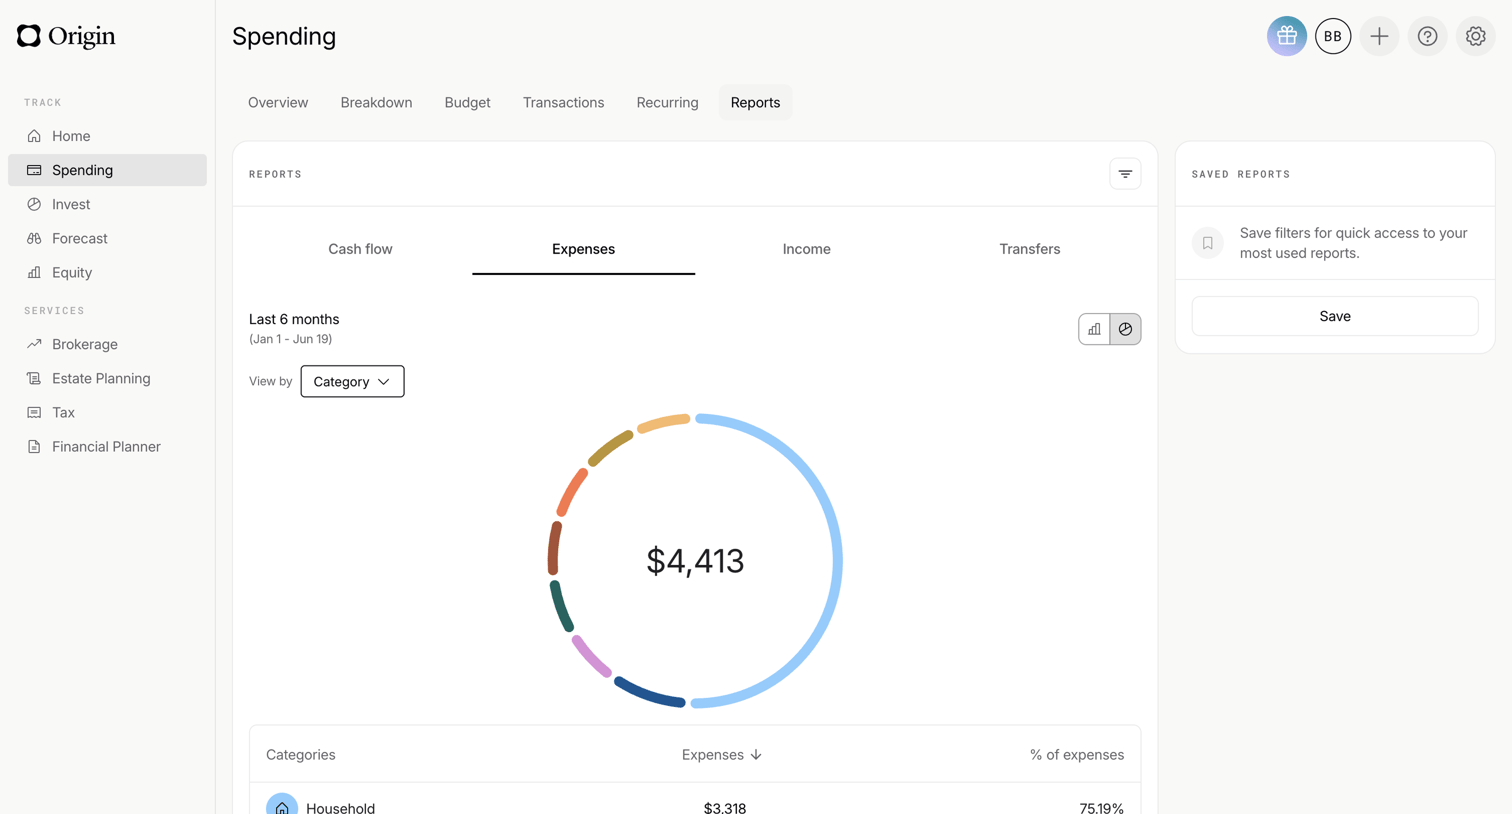

Analytics page where the user views a breakdown of their expenses over the last 6 months by category, featuring a donut chart and a detailed data table.
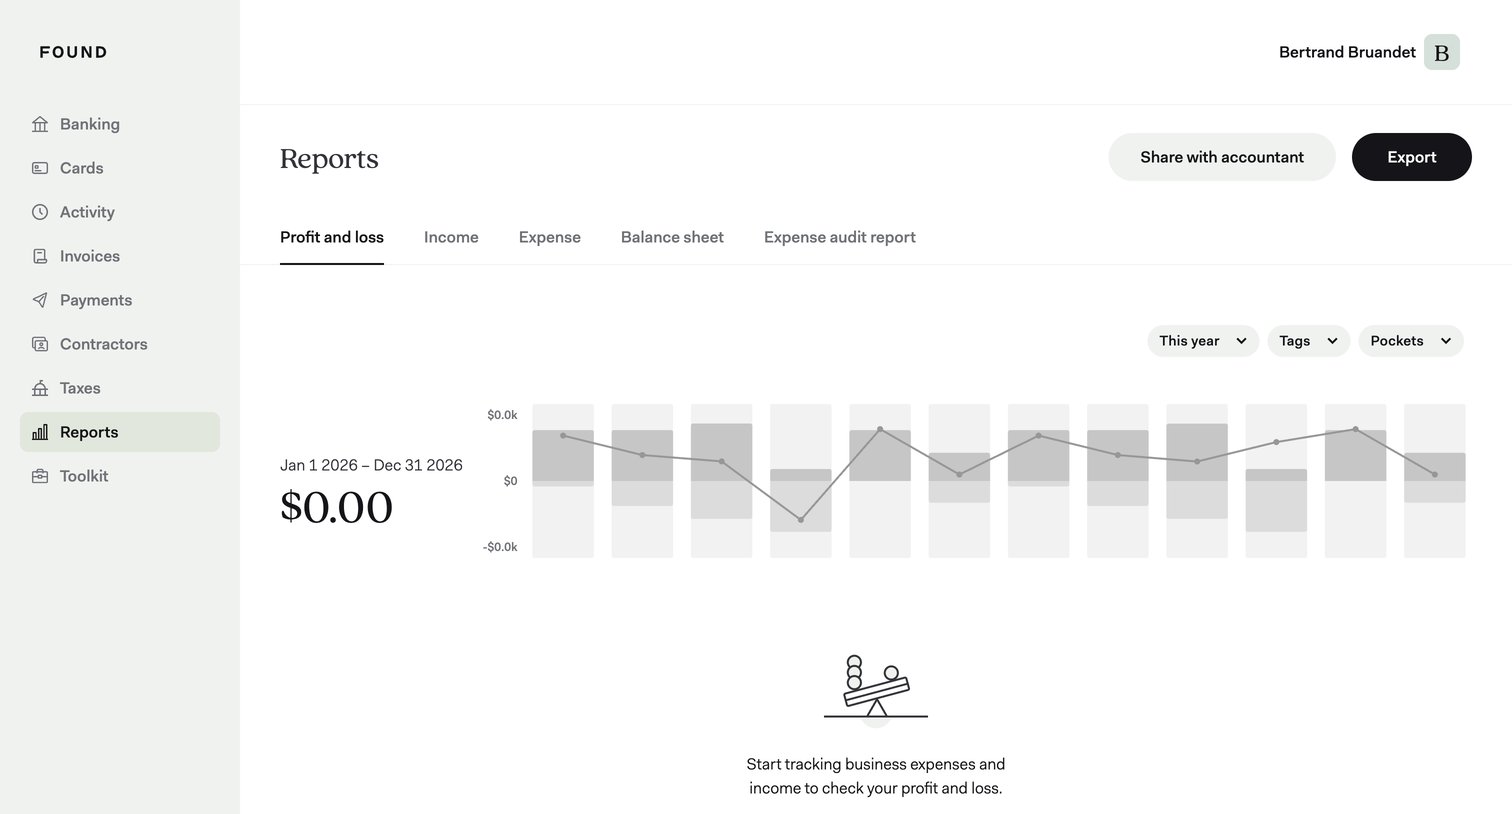

Analytics dashboard showing an empty profit and loss report with a prompt to start tracking expenses, alongside filters for year, tags, and pockets.
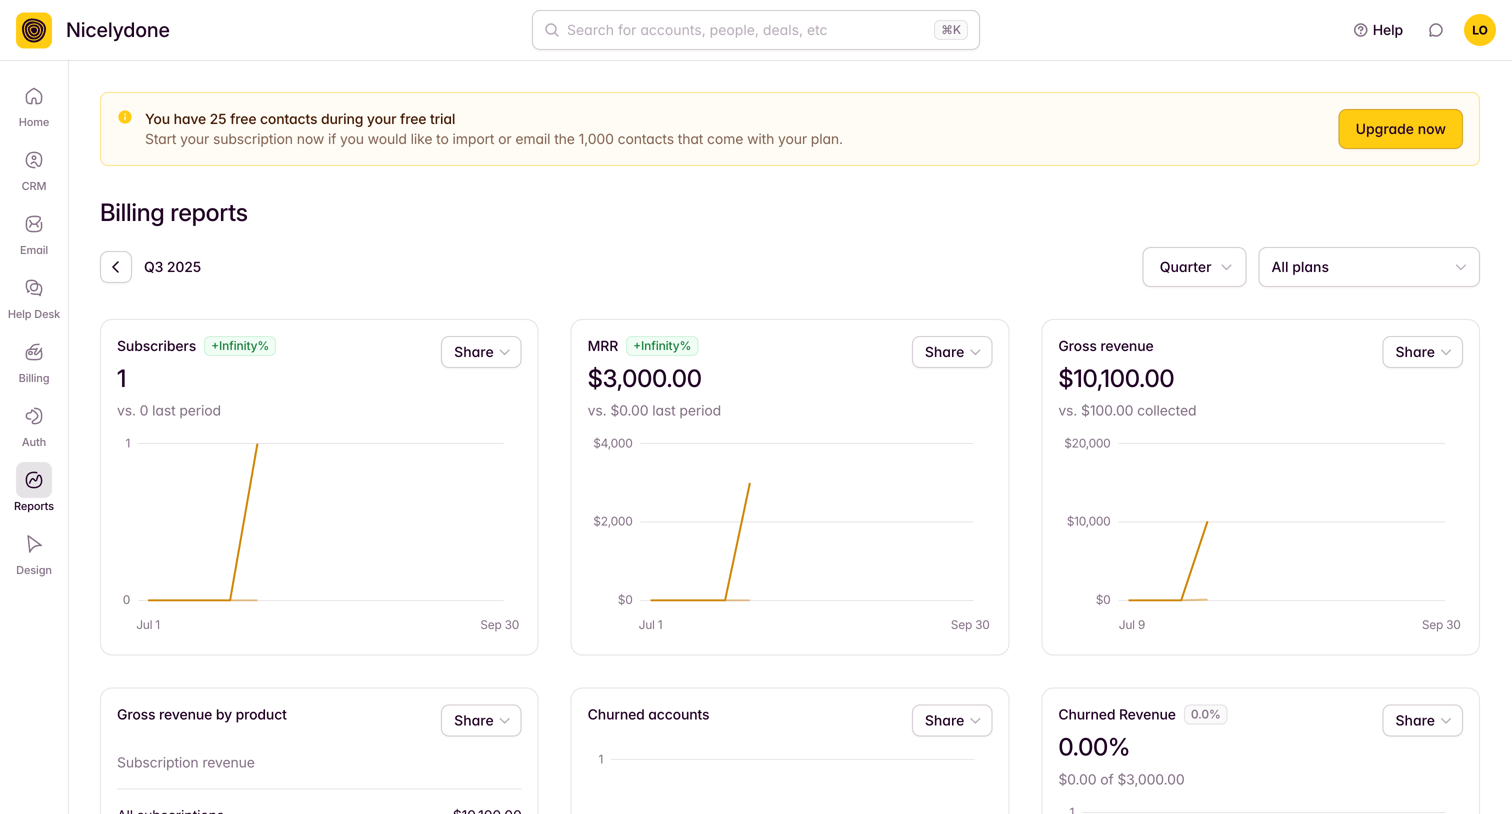

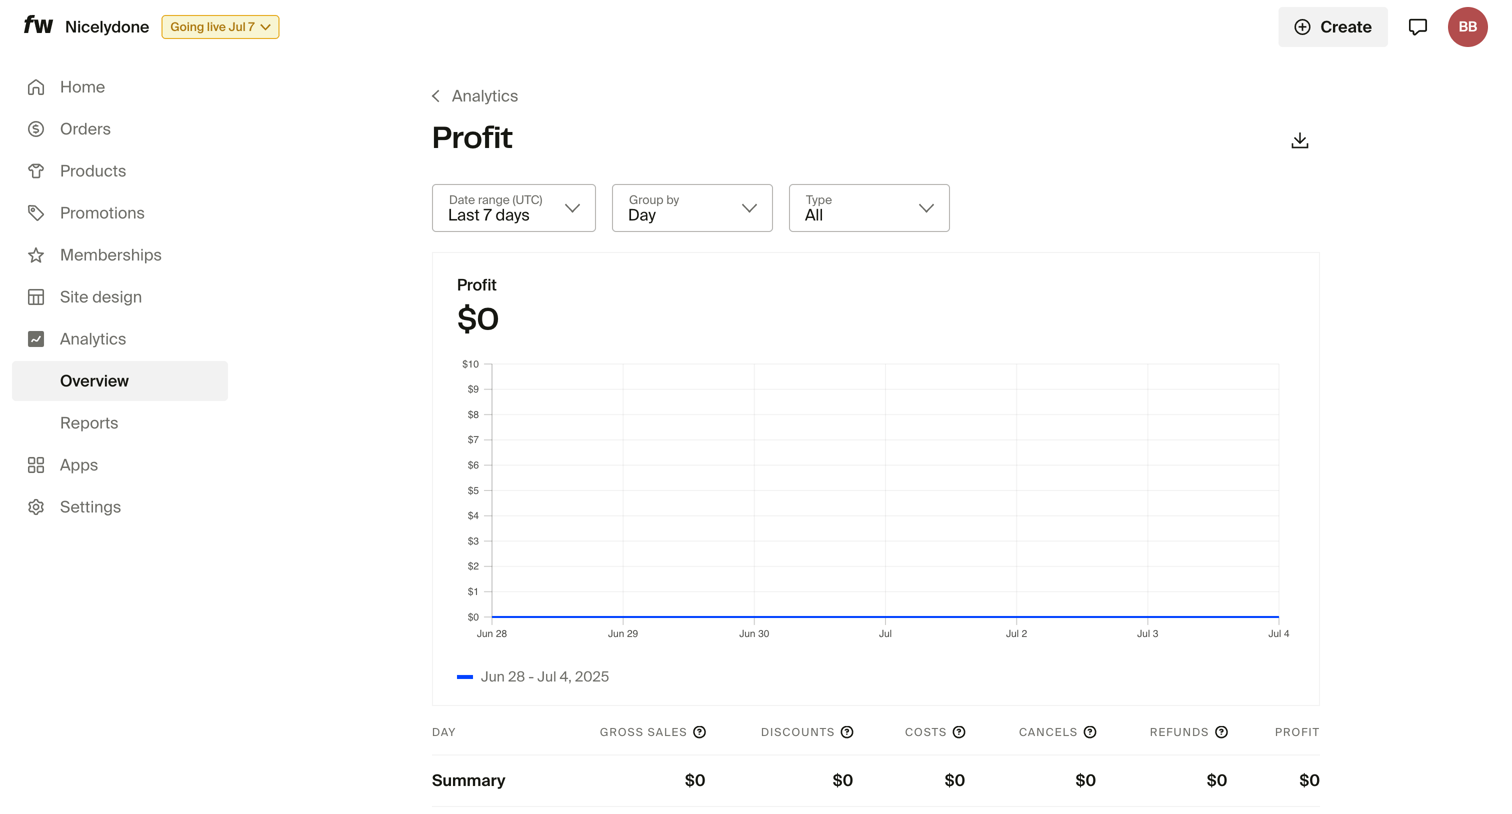

Dashboard showing profit analytics with a line chart and a detailed breakdown table by day, filterable by date range and type.
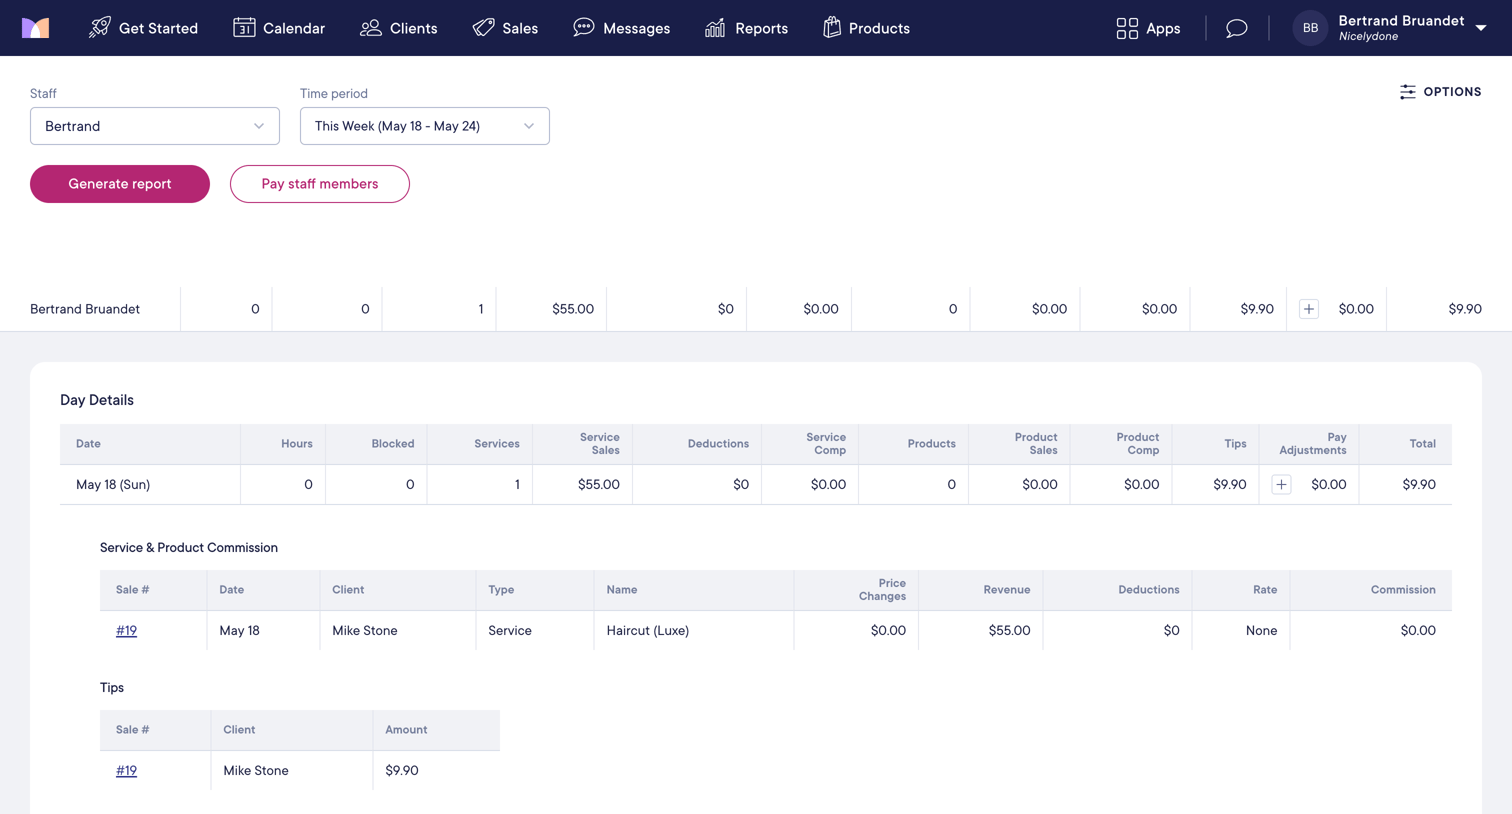

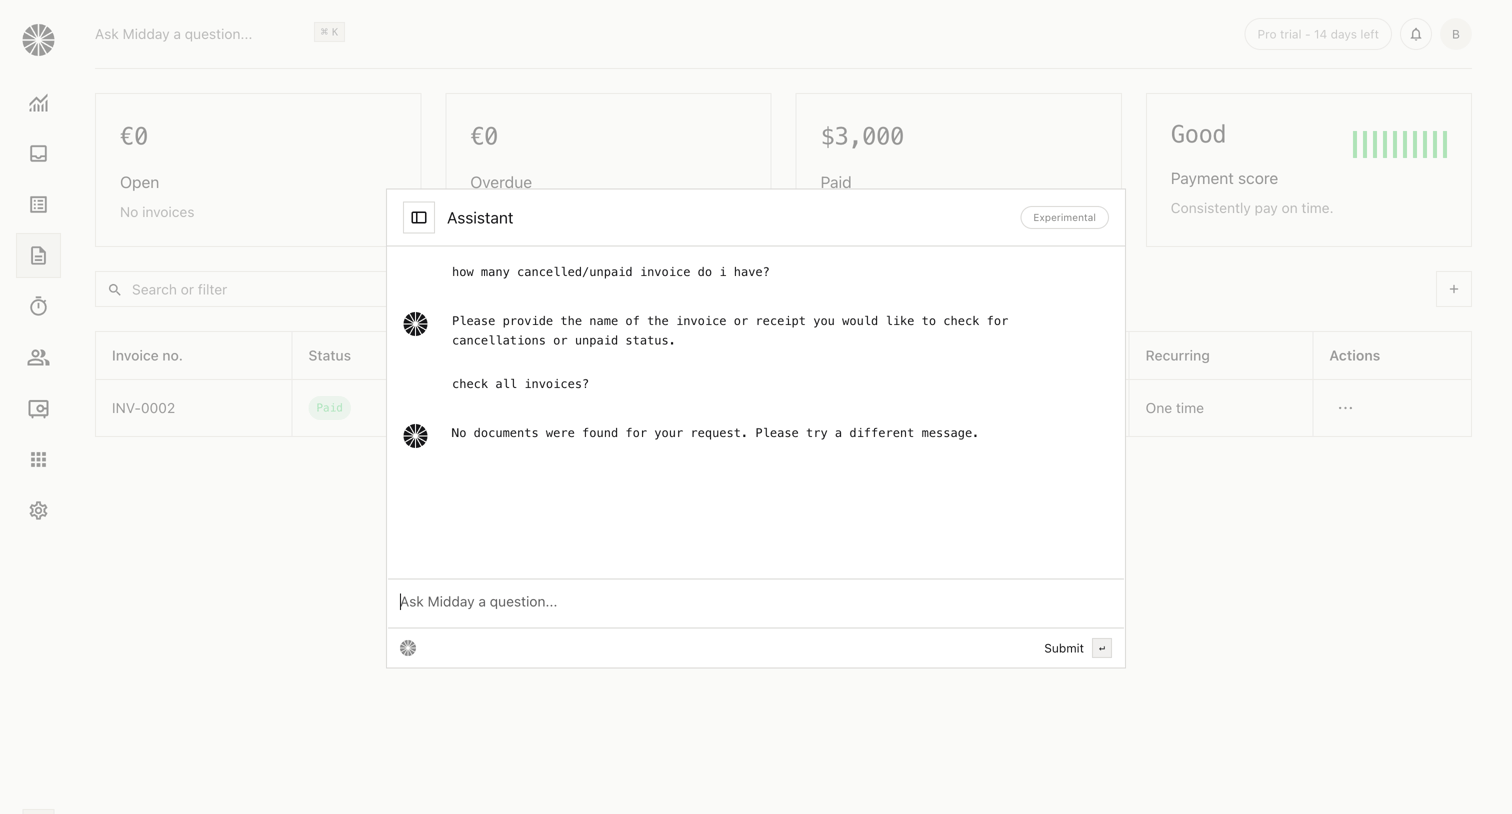

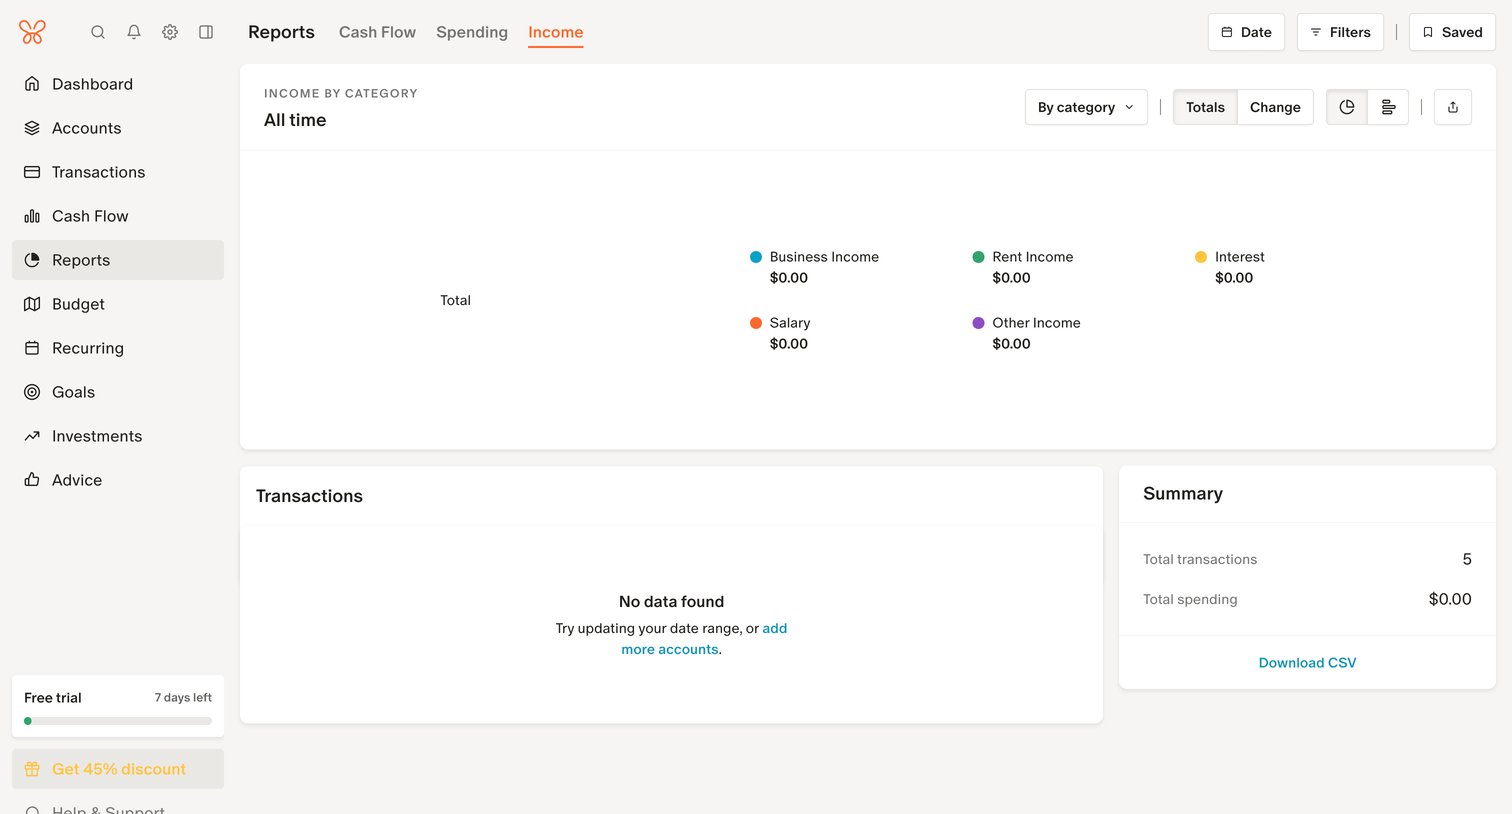

Dashboard showing an income report by category, currently displaying an empty state for transactions and a summary card, with a prompt to update the date range or add accounts.
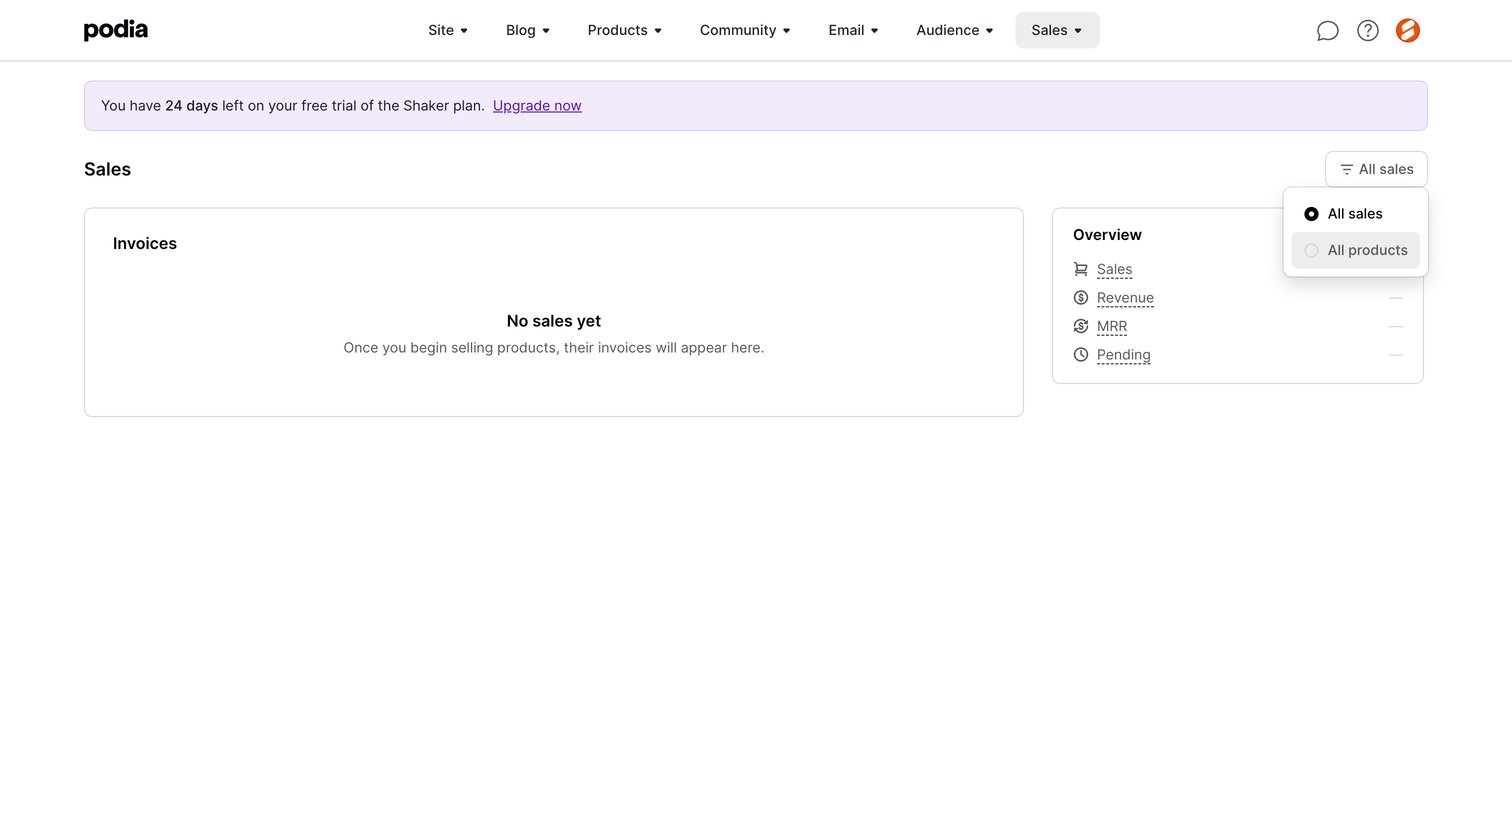

Sales dashboard in an empty state showing a trial countdown banner and a placeholder metrics overview.
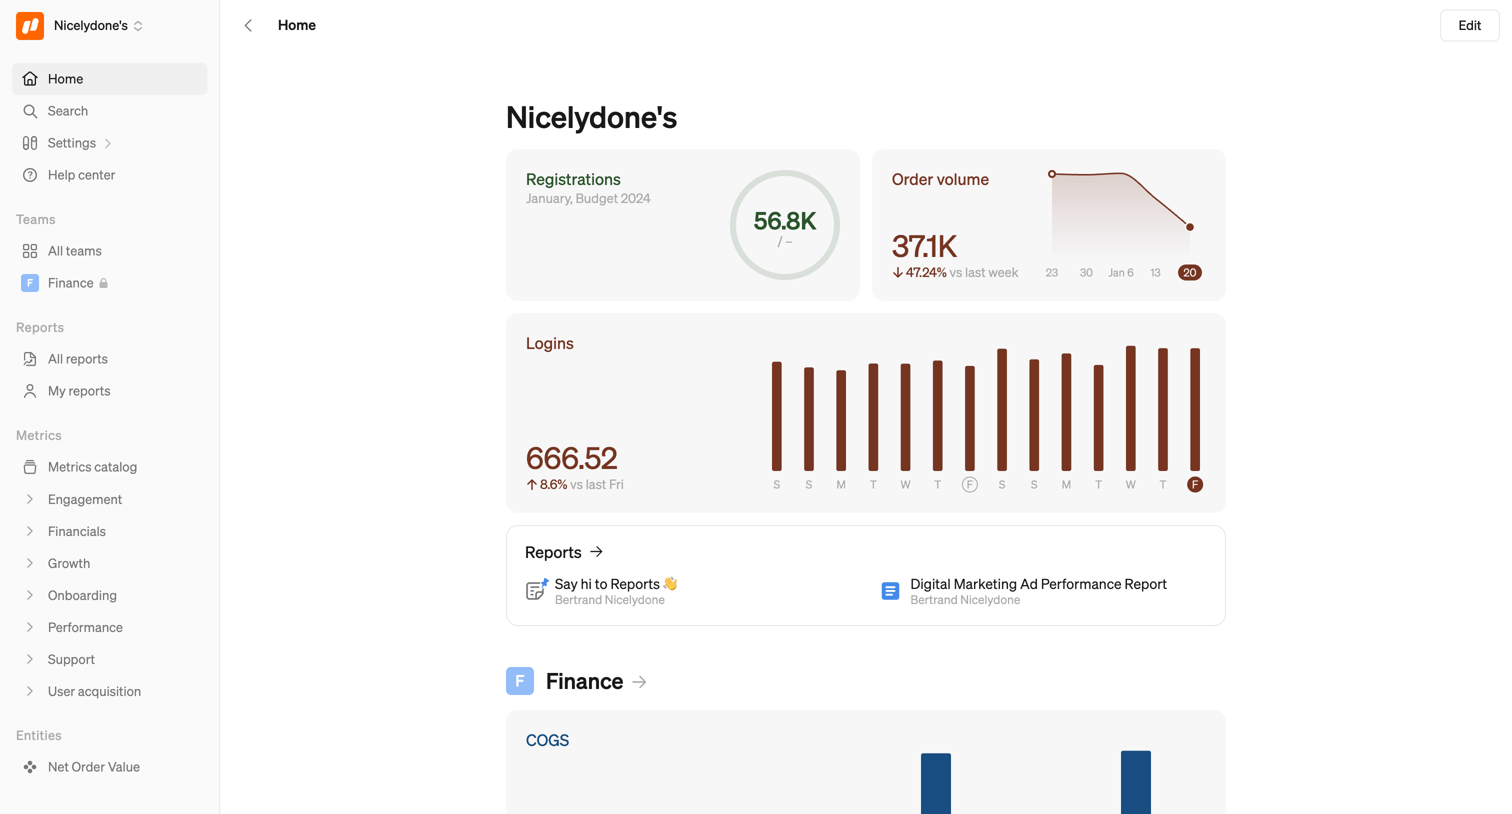

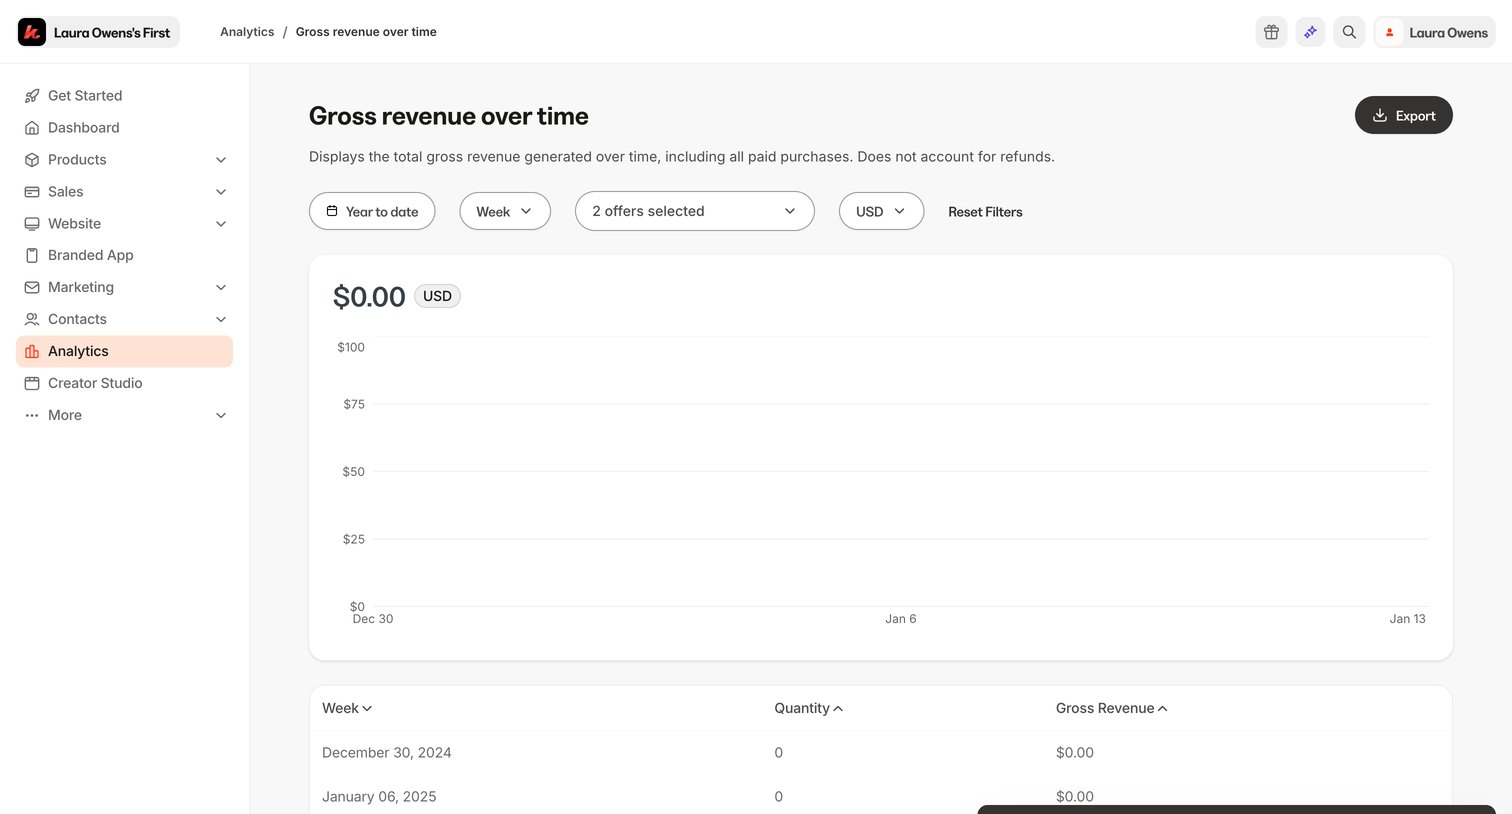

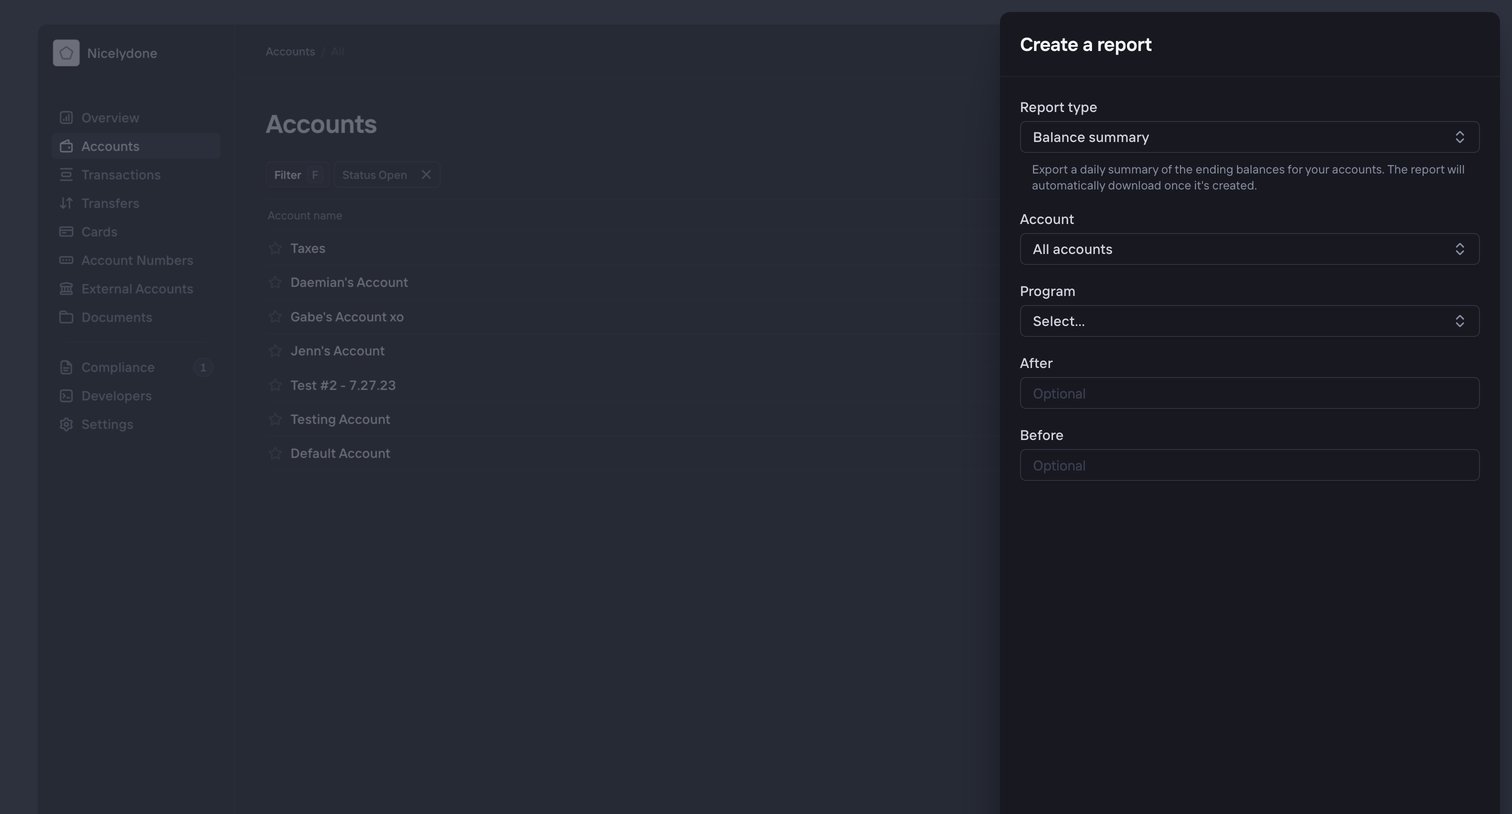

List view of accounts with a side drawer open to configure and export a balance summary report to CSV.
Explore the full SaaS screen library
Upgrade to unlock the full library.
Trusted by the best teams







