Business intelligence screen examples
Business intelligence screen design examples from SaaS apps. Browse examples from Dock, Mixpanel, Gumloop.
Explore the examples
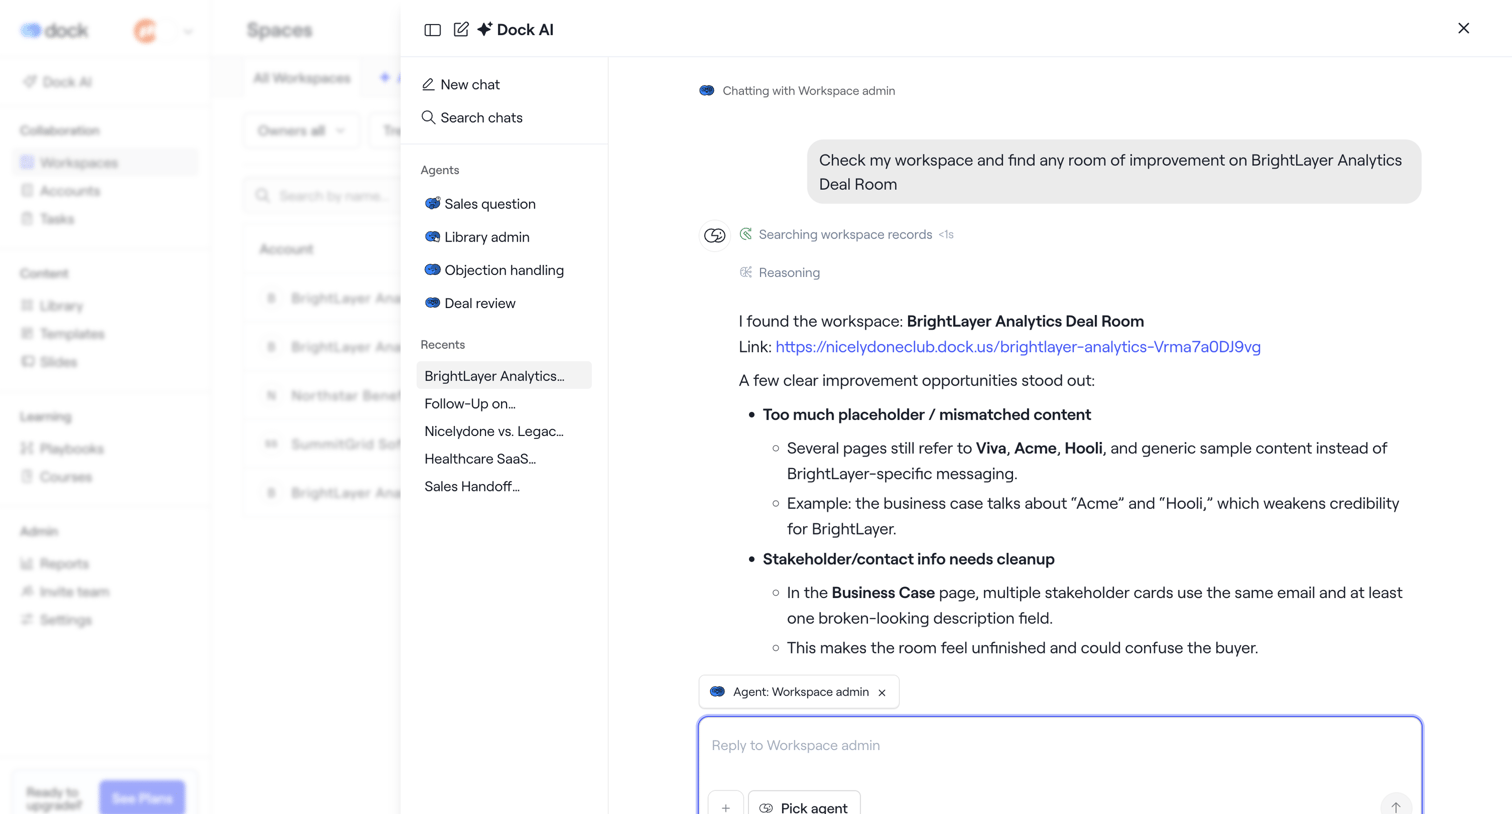

AI chat overlay where the user asks a workspace admin agent to review the BrightLayer Analytics Deal Room for improvements.
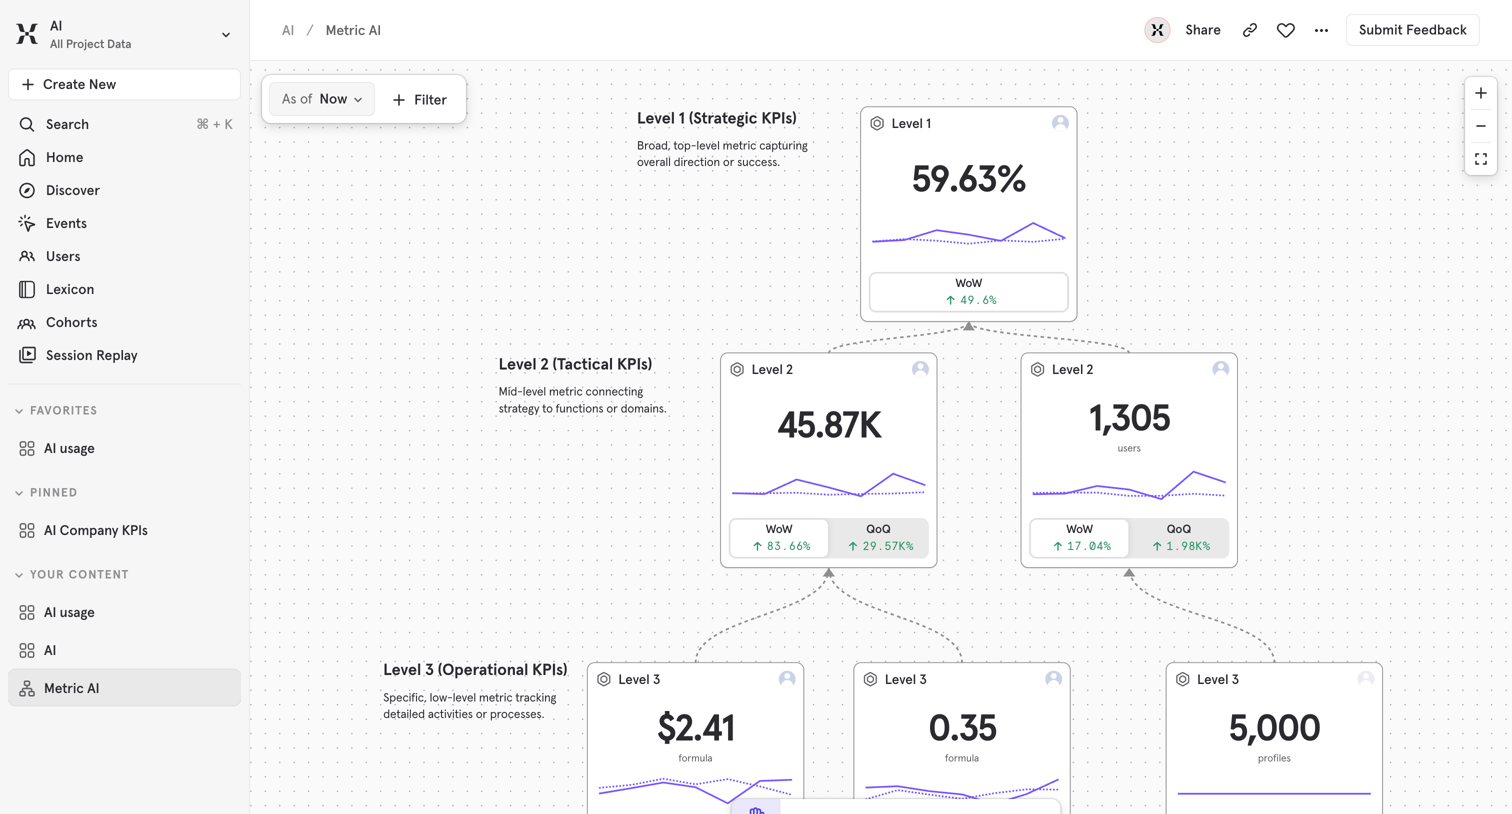

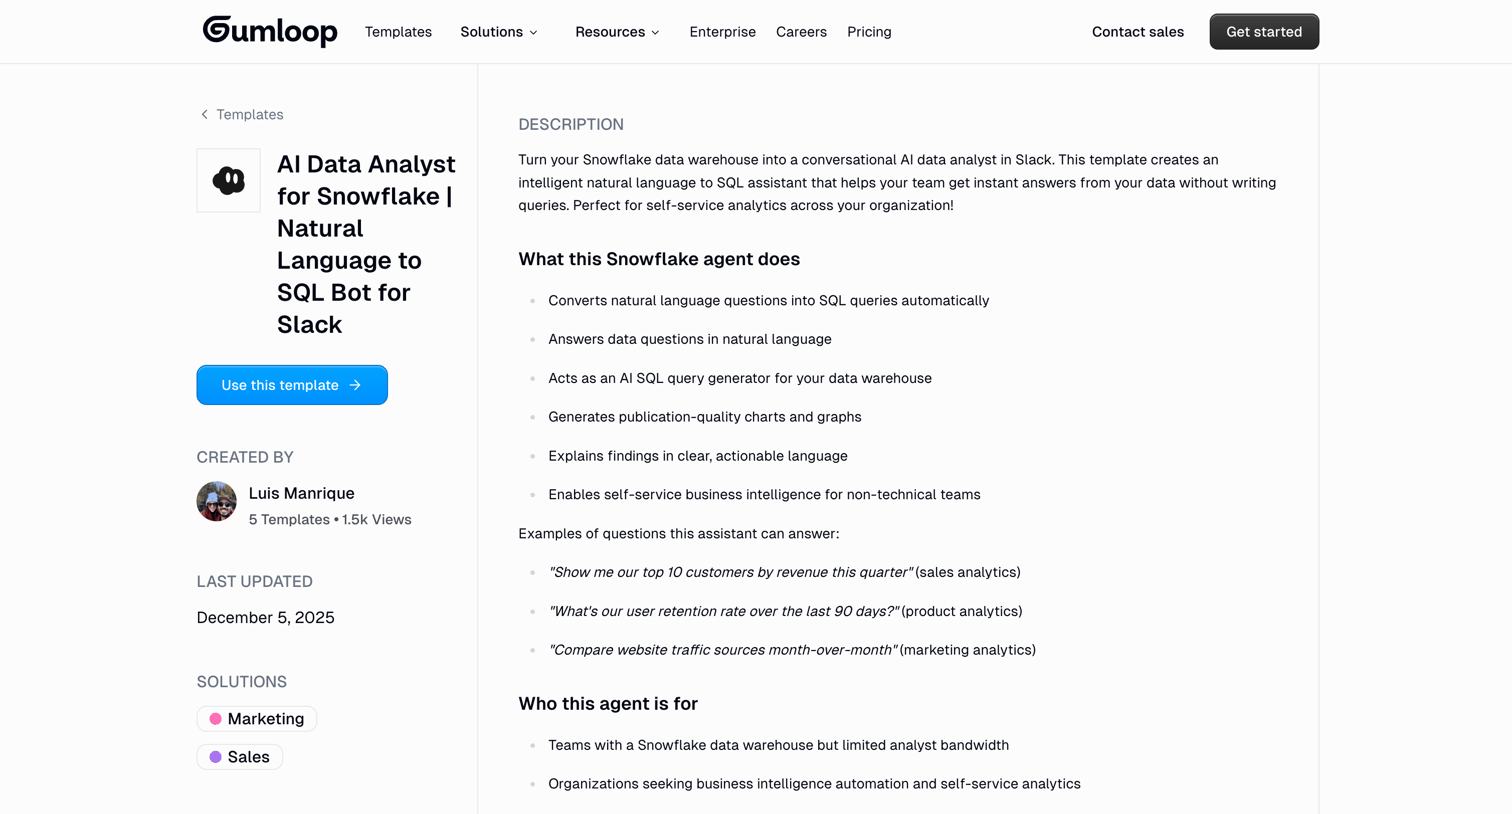

Product page detailing a pre-built template for an AI data analyst bot that connects Snowflake and Slack, including setup instructions and required tools.
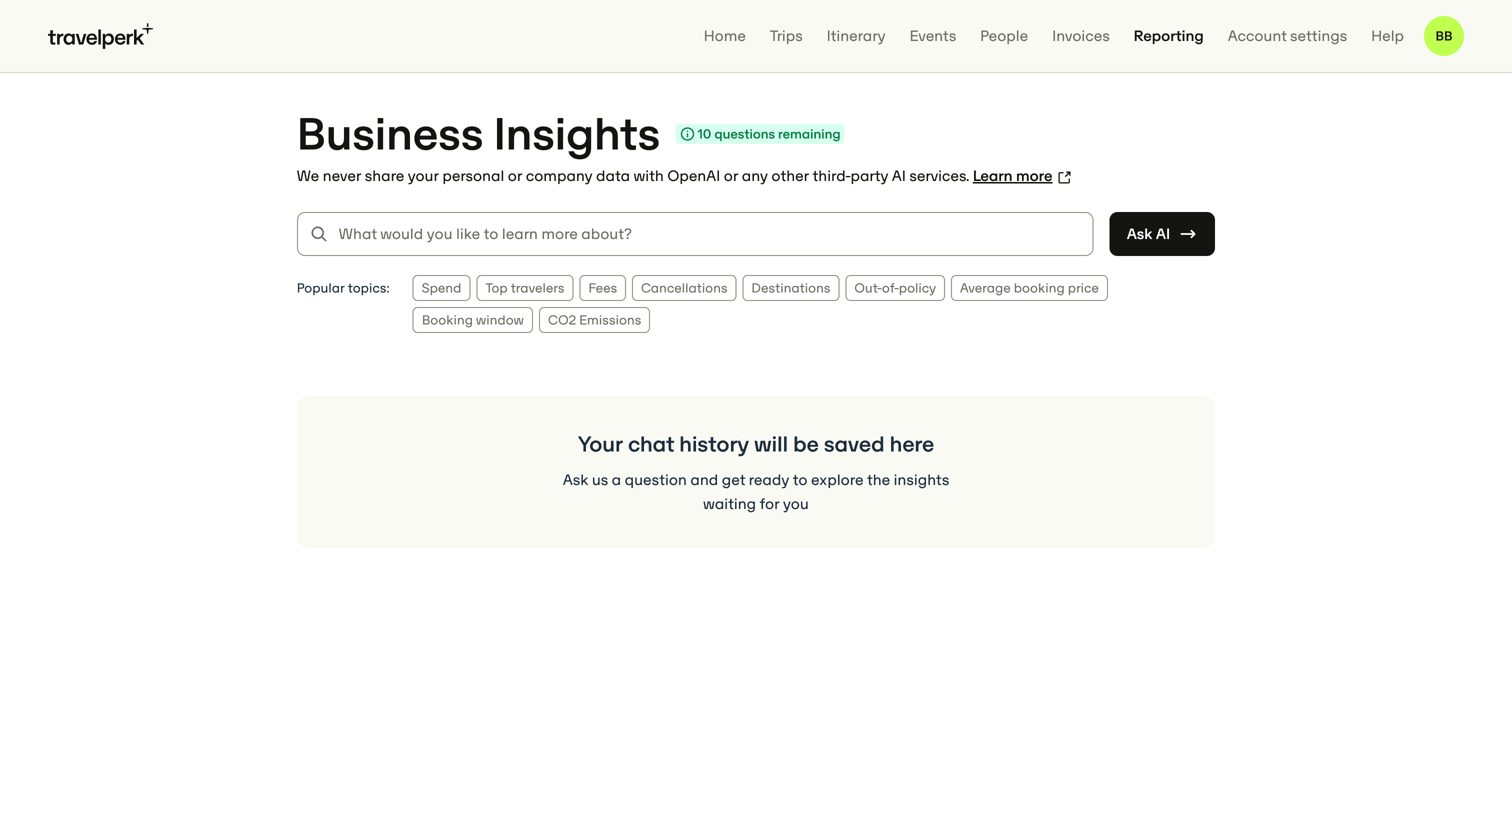

AI chat interface where the user can query business insights using natural language, currently showing an empty state with prompt suggestions and a data privacy notice.
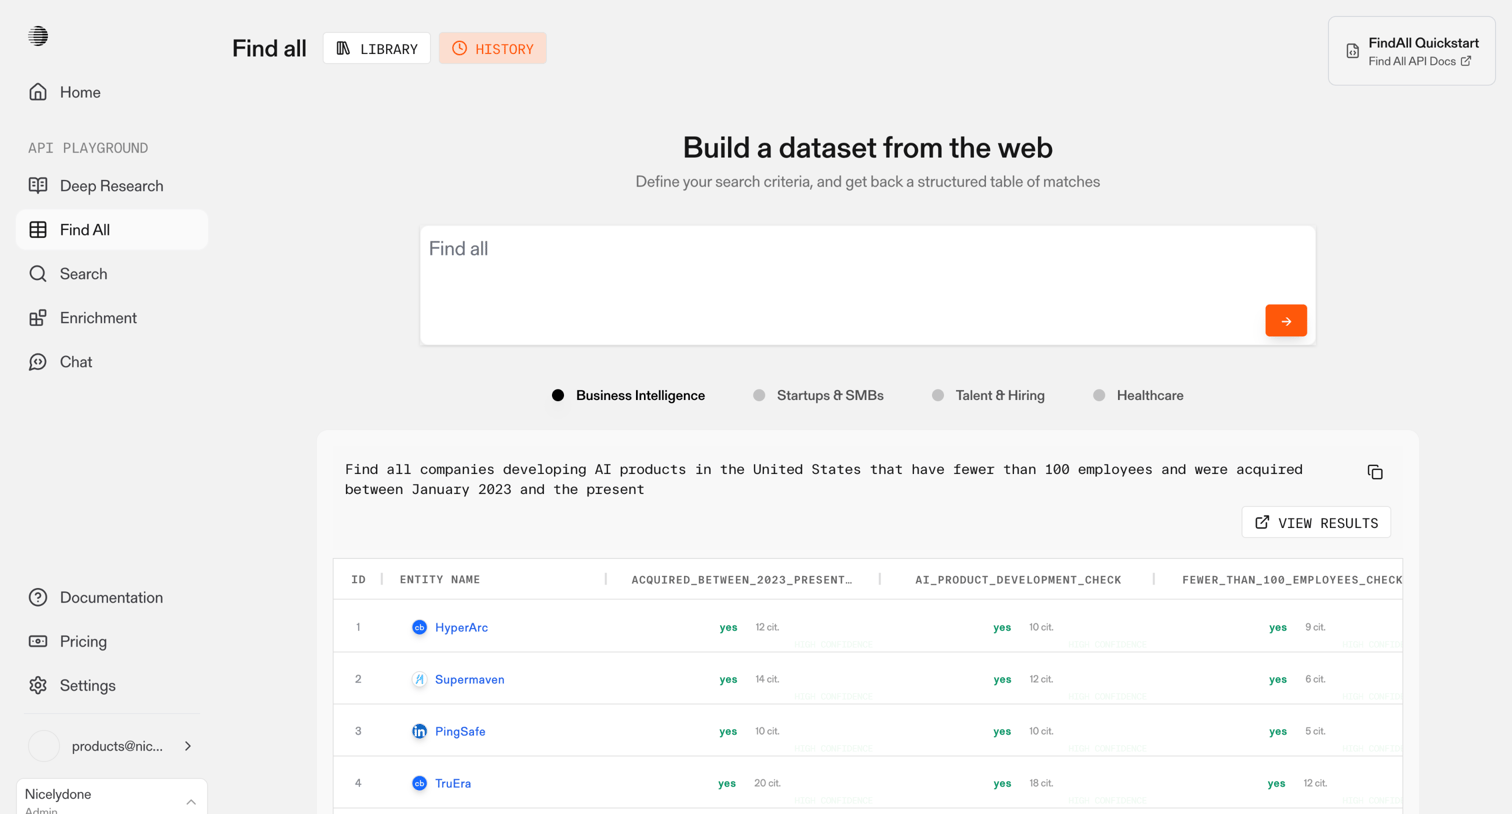

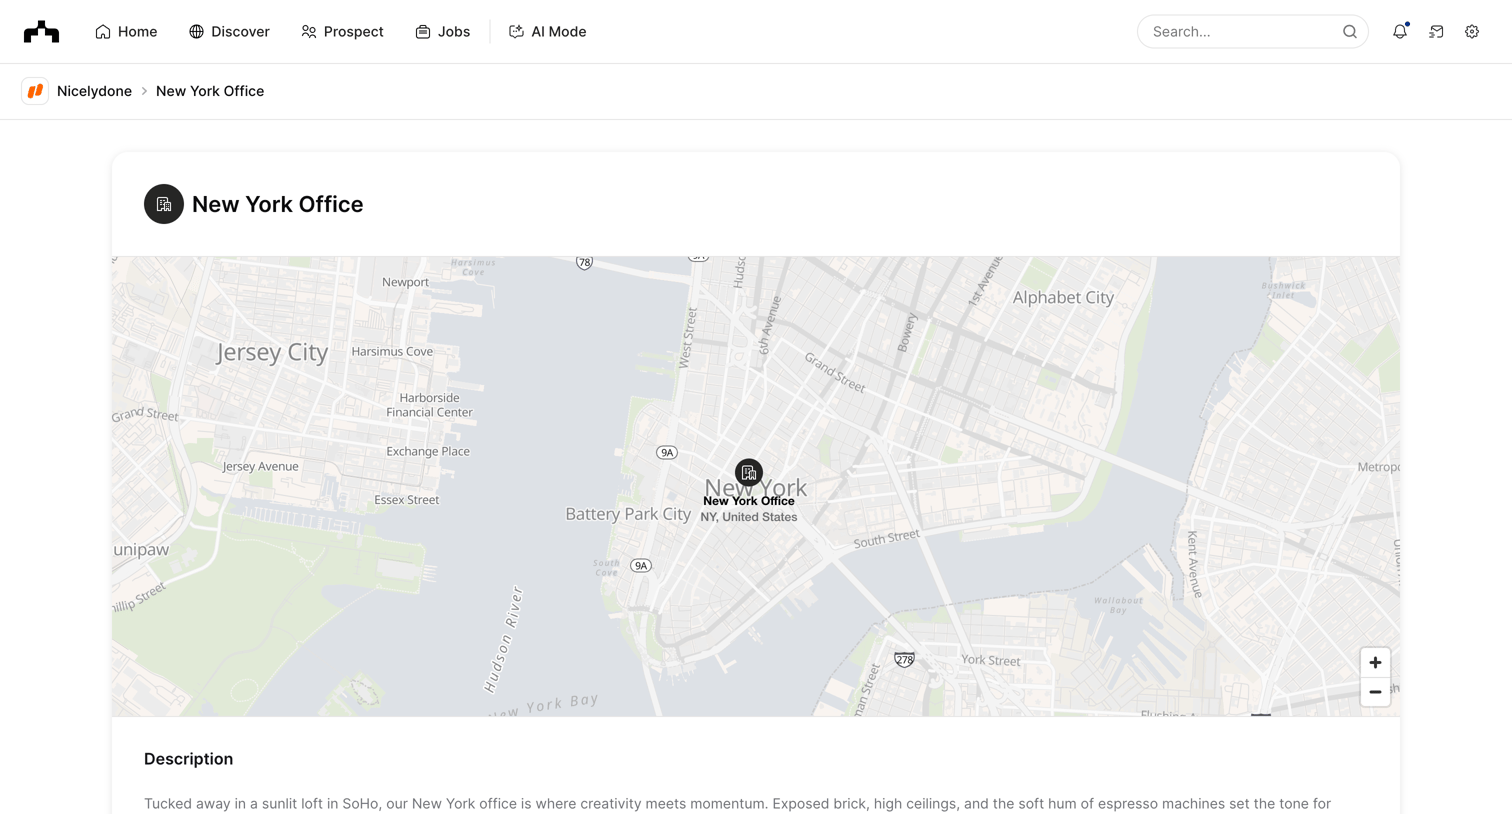

Detail page for a company's specific office location, showing an interactive map, a text description, associated people, and open jobs.
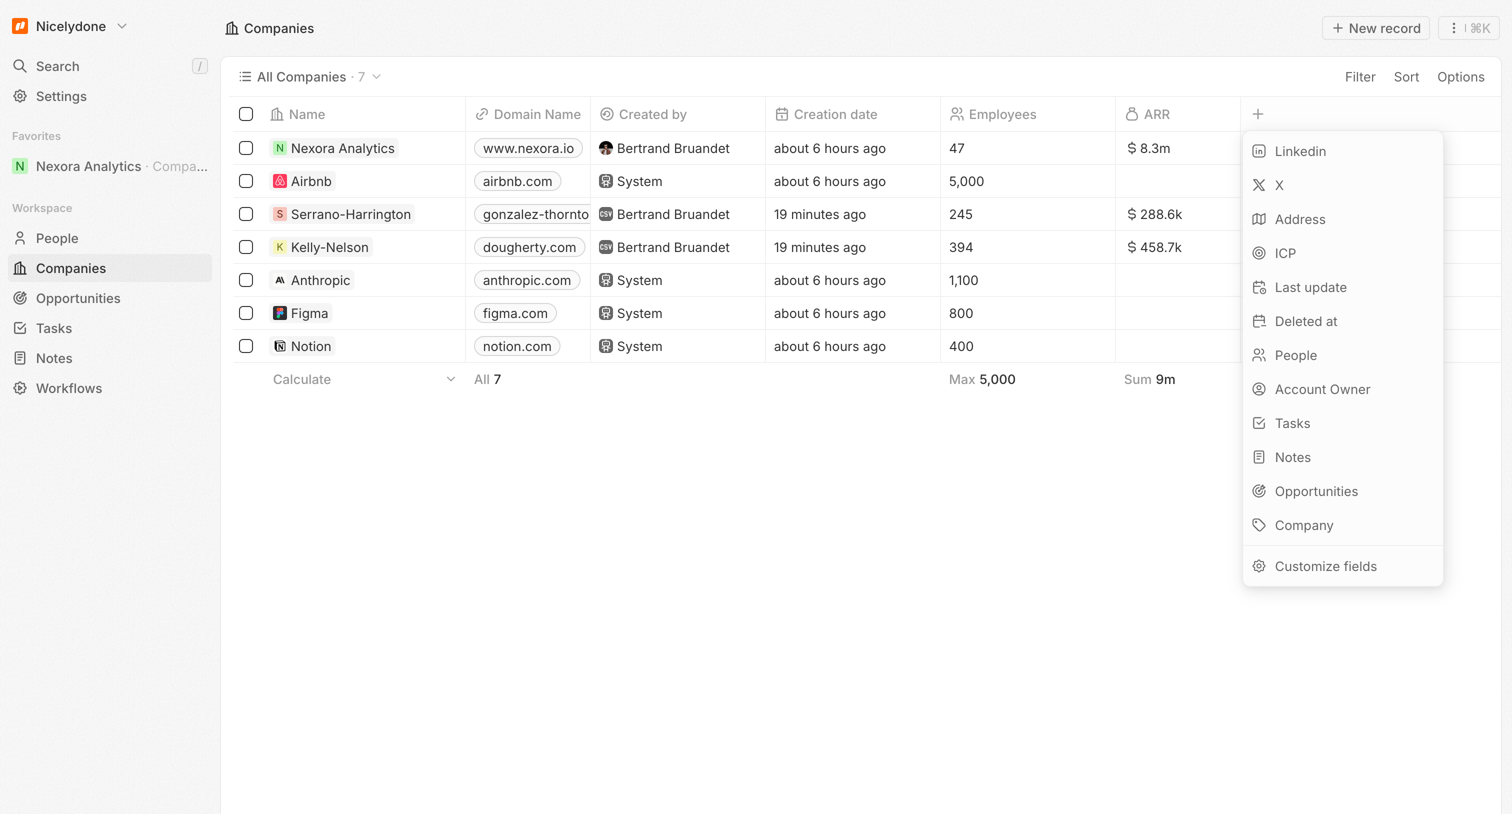

List view displaying a directory of companies with an open dropdown menu to customize visible columns.
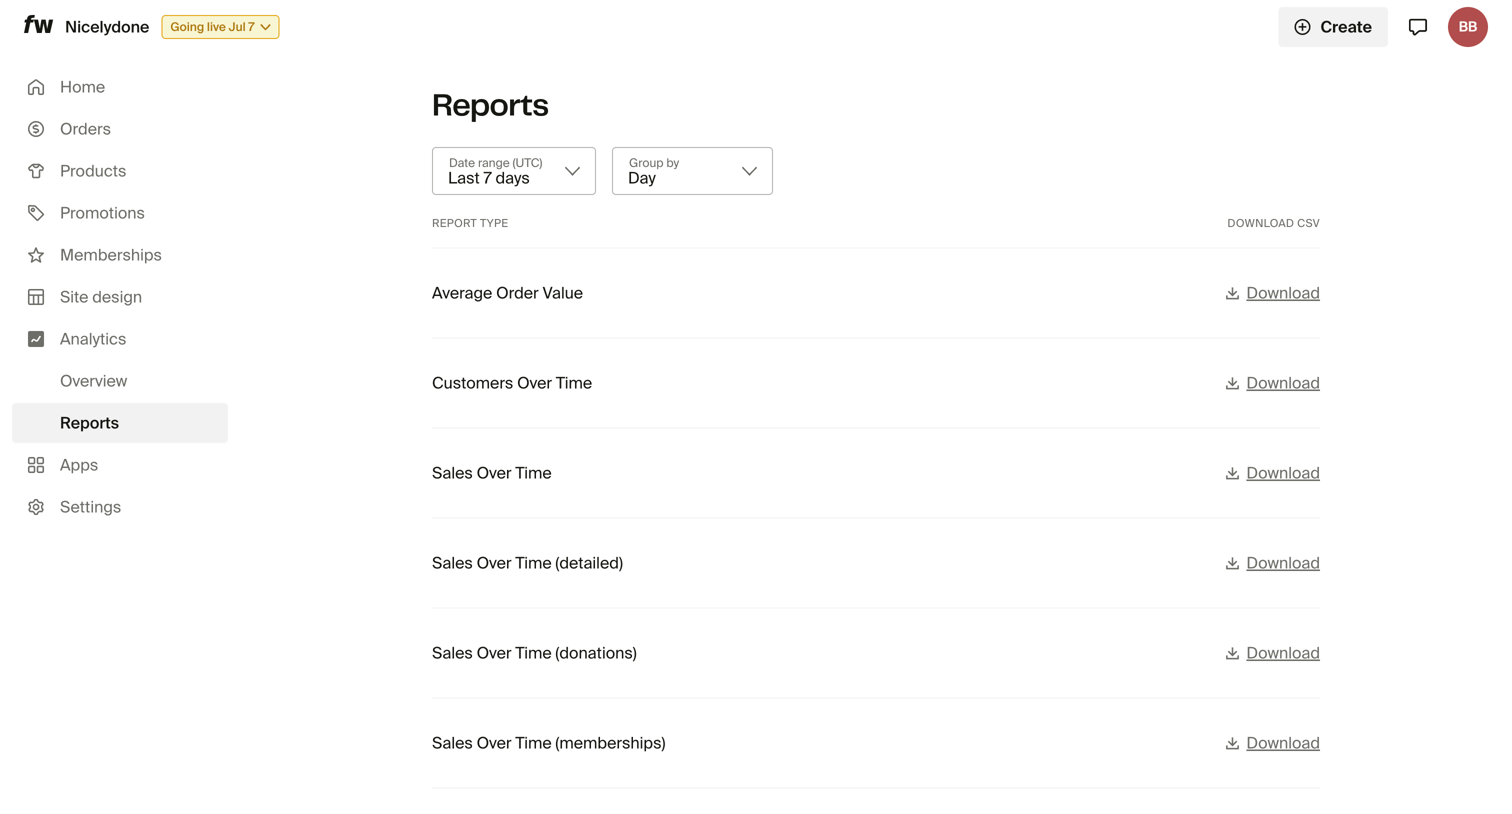

List view where the user can filter by date range and grouping to download CSV reports for various sales and customer metrics.
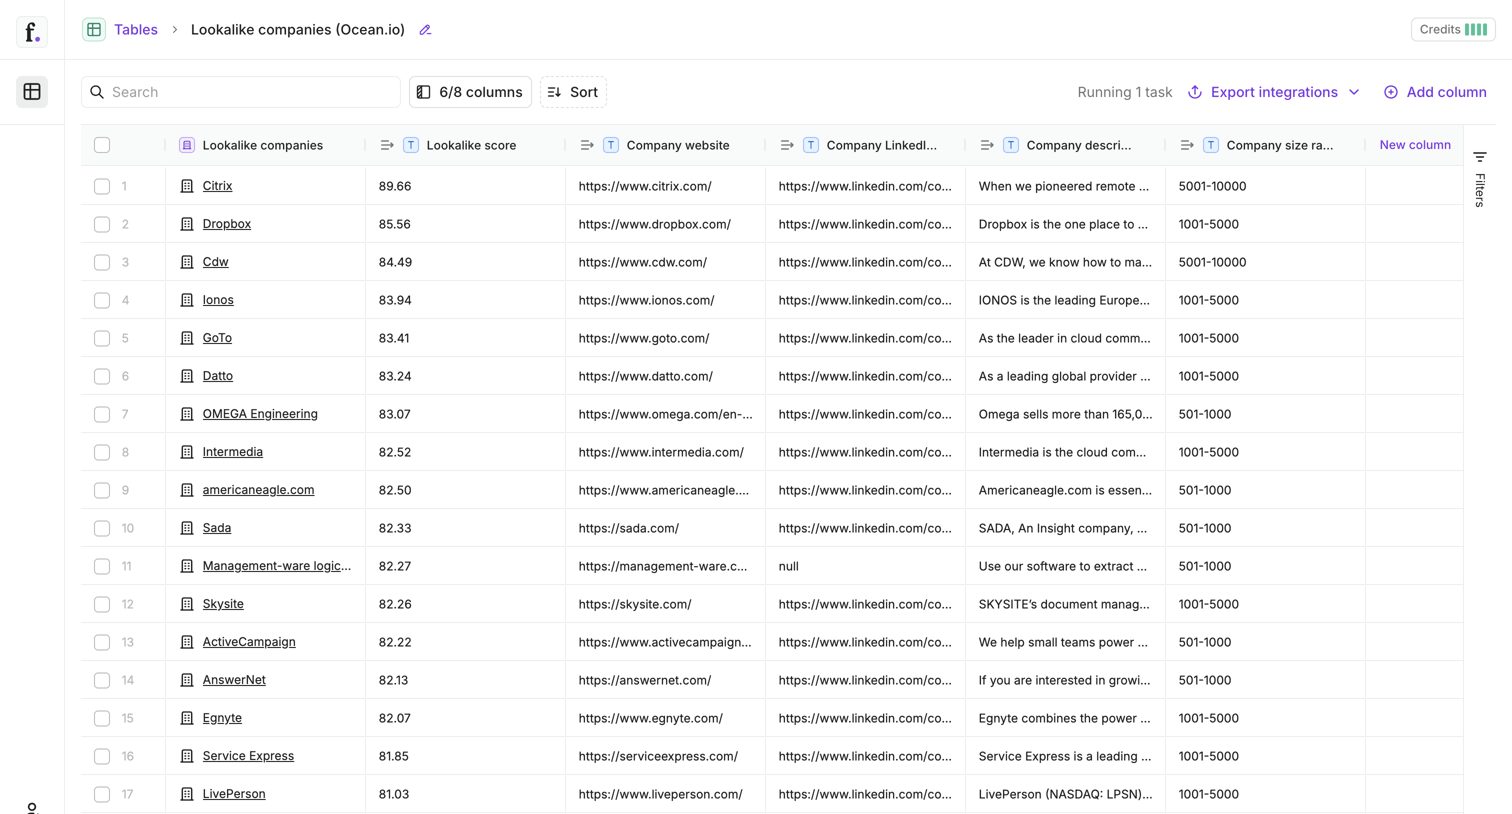

Data table view displaying a list of lookalike companies with columns for score, website, LinkedIn, description, and size, along with tools to search, sort, and export the data.
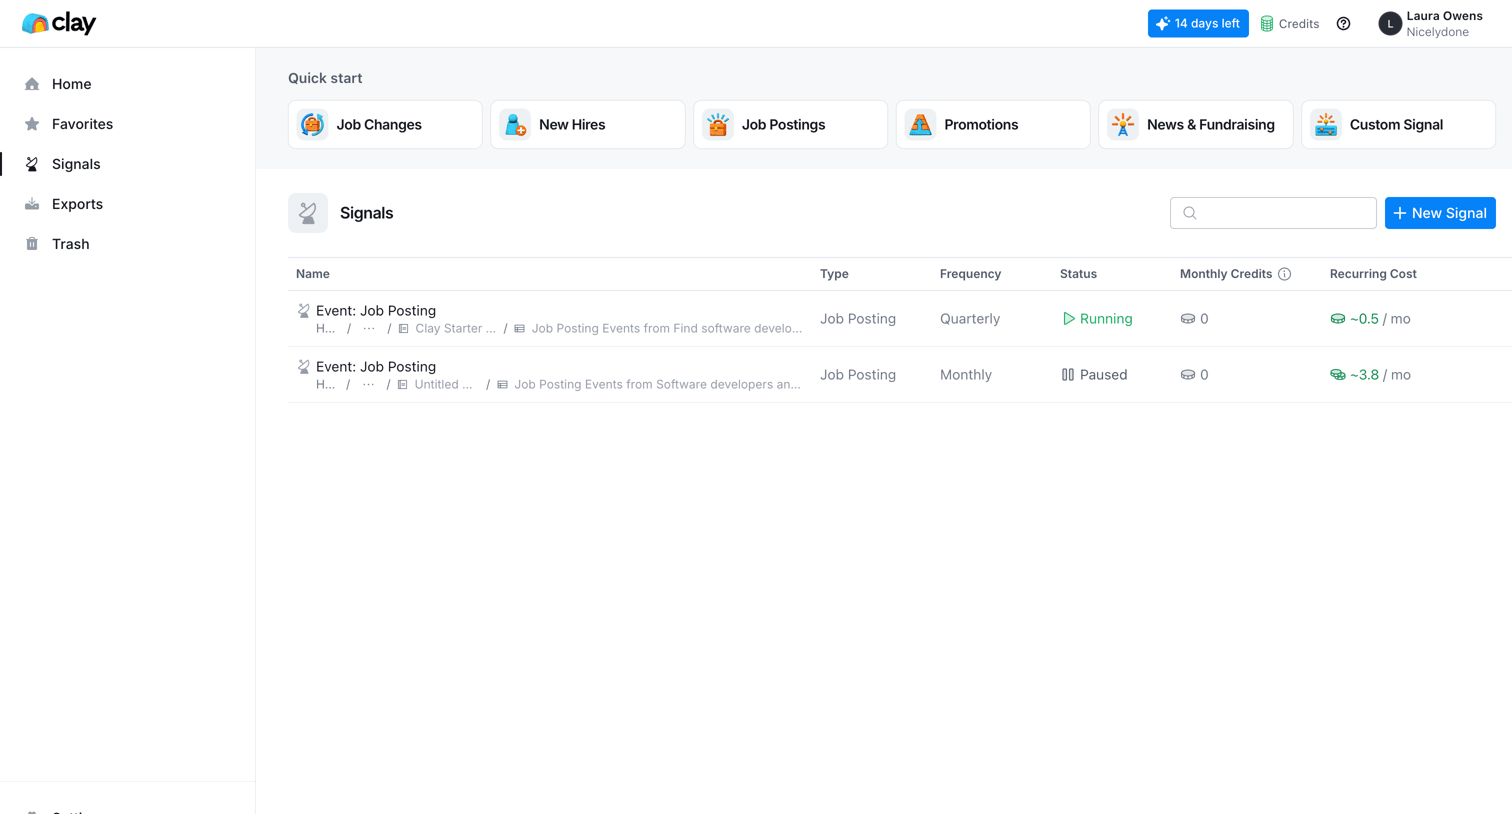

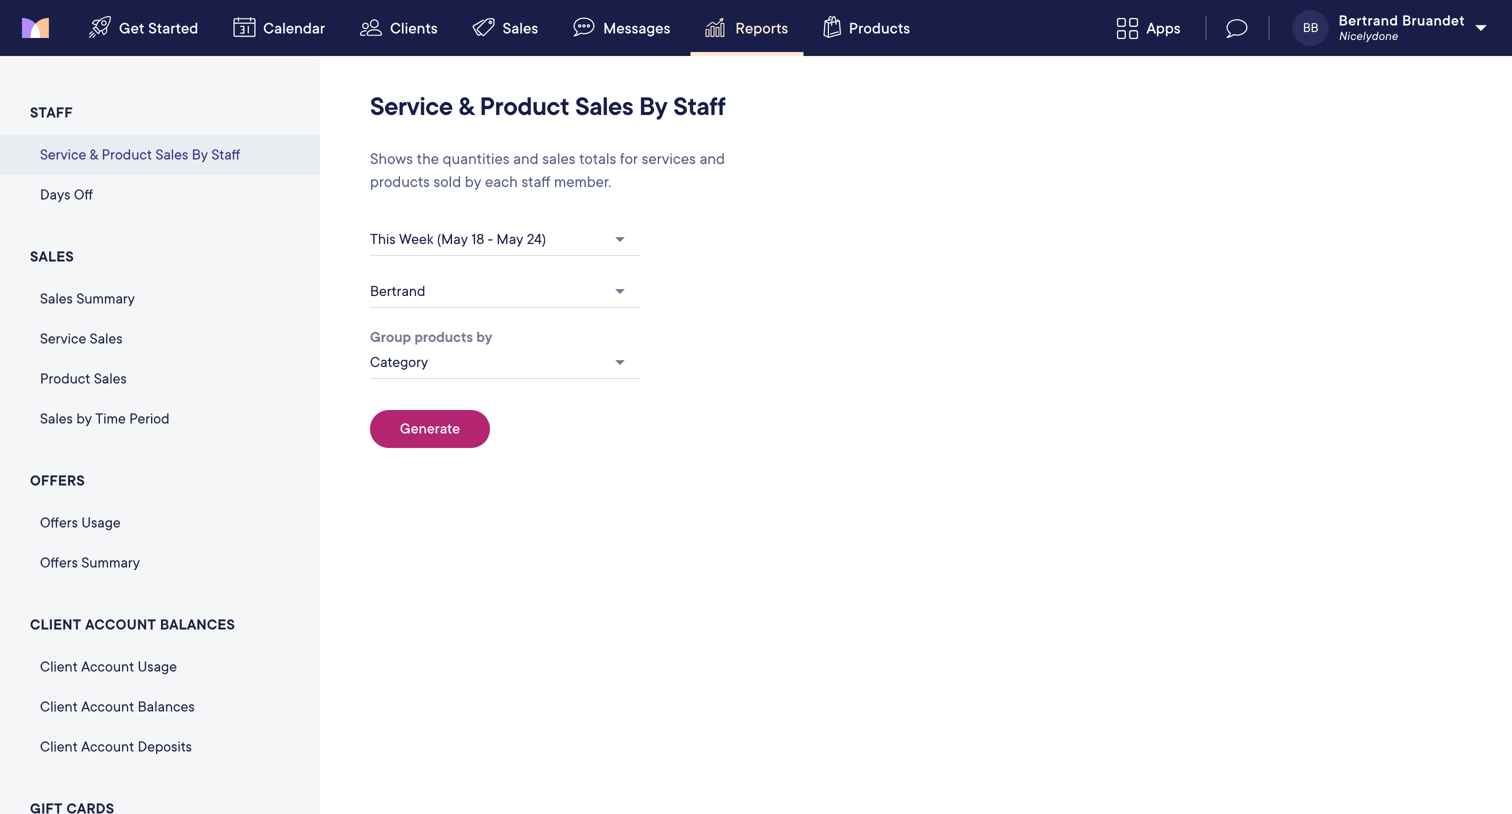

Analytics configuration page where the user selects a date range, staff member, and grouping category before generating a service and product sales report.
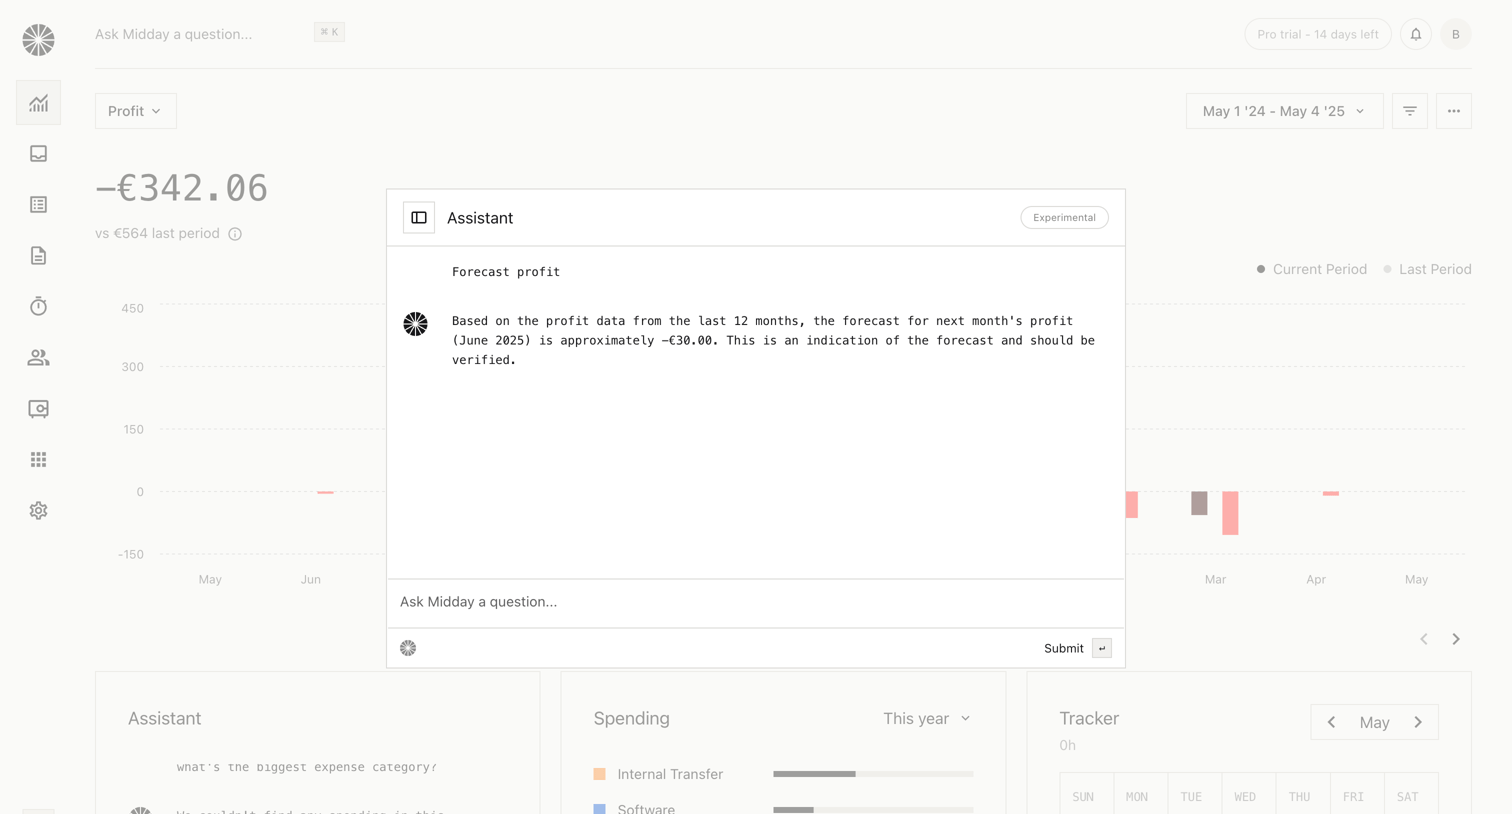

Financial dashboard displaying profit metrics and spending breakdowns, with an active AI assistant modal answering a forecast question.
Explore the full SaaS screen library
Upgrade to unlock the full library.
Trusted by the best teams







