Skip to content

SaaS metrics screen examples

SaaS metrics screen design examples from SaaS apps. Browse examples from Polar, Dock, Documentation.AI.

Explore the examples
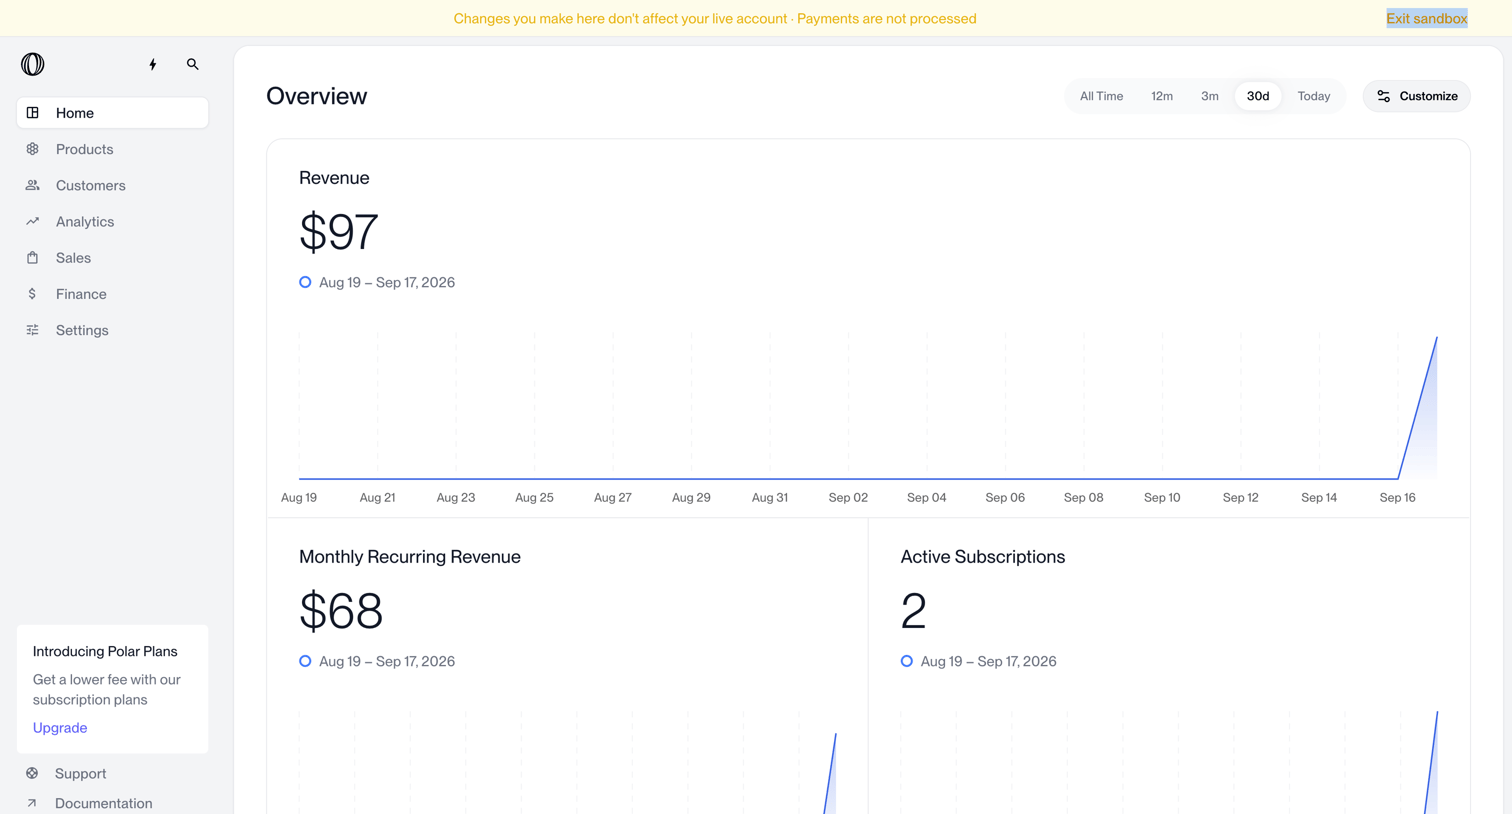
Polar - Overview | Nicelydone | Polar screen
Polar logo
Polar

Dashboard showing revenue, MRR, and active subscriptions metrics with line charts in a sandbox environment.

Dock - Reports · Dock screen
Dock logo
Dock

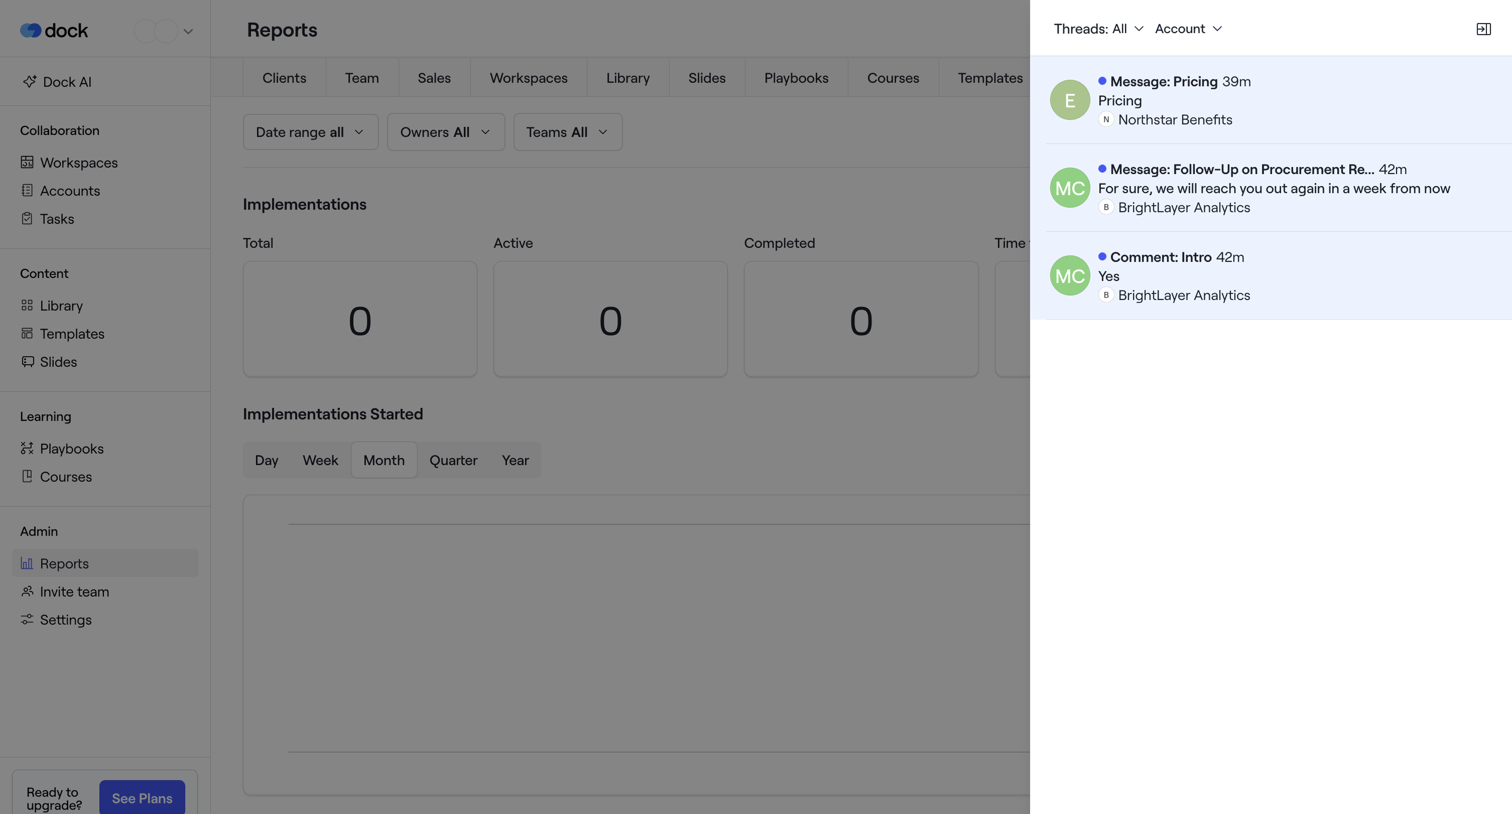
Dashboard showing implementation reports with zero-state KPIs for total, active, and completed implementations, alongside a right-hand activity feed of recent messages.

Documentation.AI - Dashboard - Documentation.AI screen
Documentation.AI logo
Documentation.AI

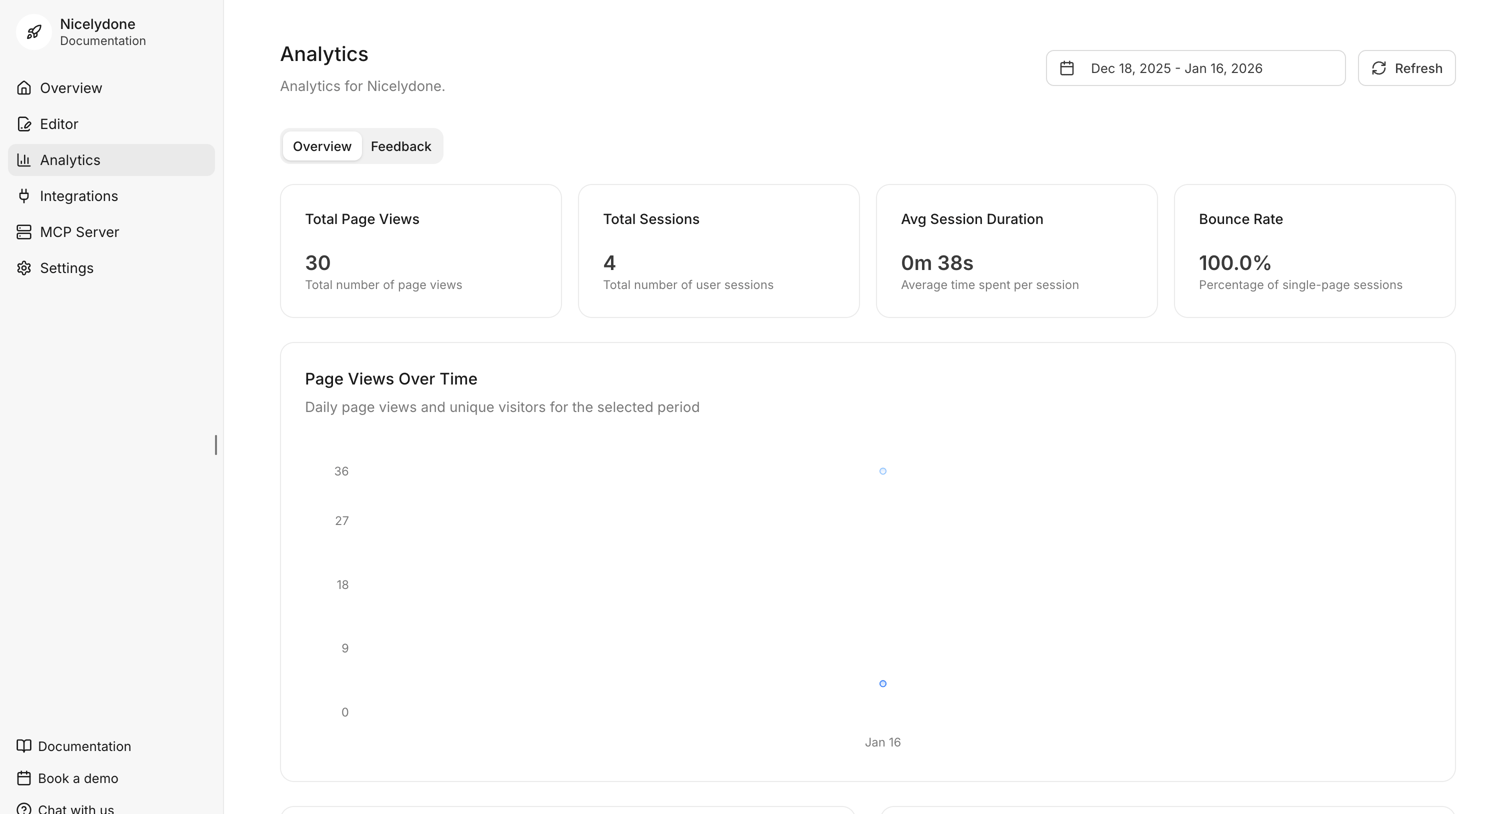
Dashboard showing documentation analytics including page views, sessions, duration, and bounce rate over a selected date range.
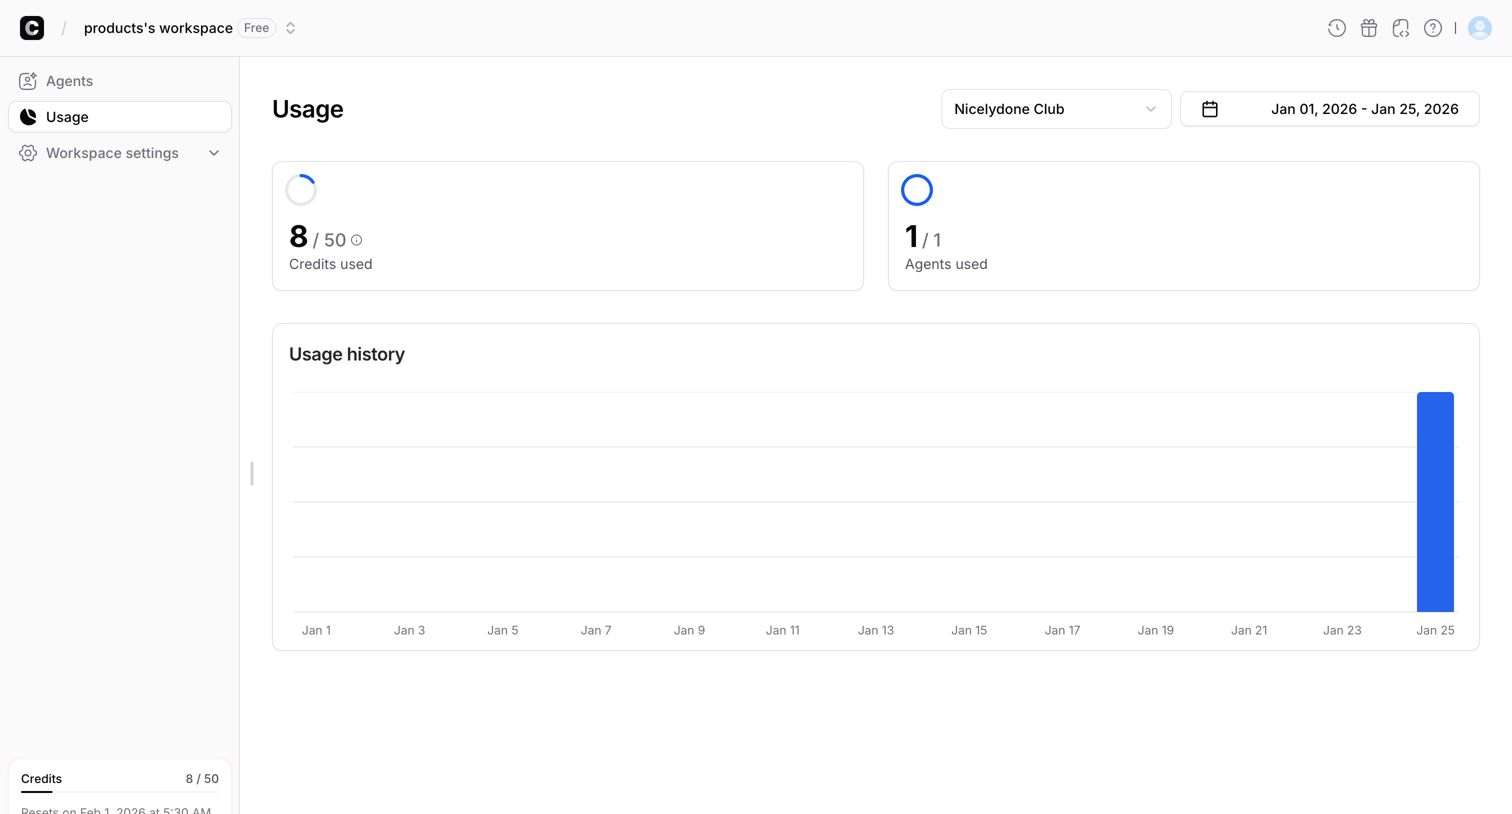

Chatbase - Usage - Chatbase screen
Chatbase logo
Chatbase

Settings page where the user monitors their workspace credit and agent consumption alongside a daily history chart.

Livekit - Nicelydone Club | Overview screen
Livekit logo
Livekit

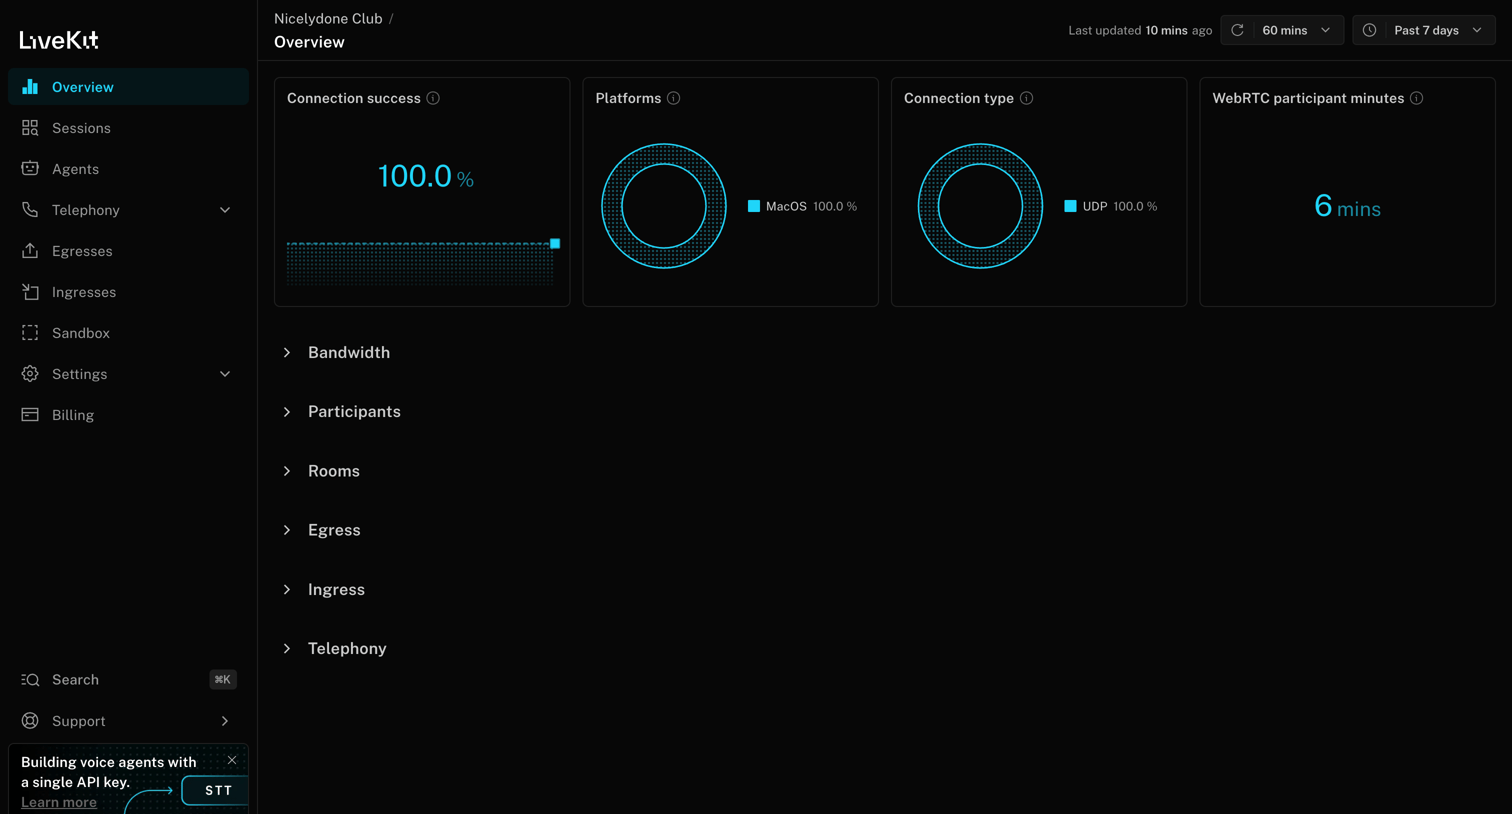
Dashboard showing connection success rates, platform distribution, and participant minutes for a specific project, with expandable sections for detailed metrics.

Cofounder screen
Cofounder logo
Cofounder

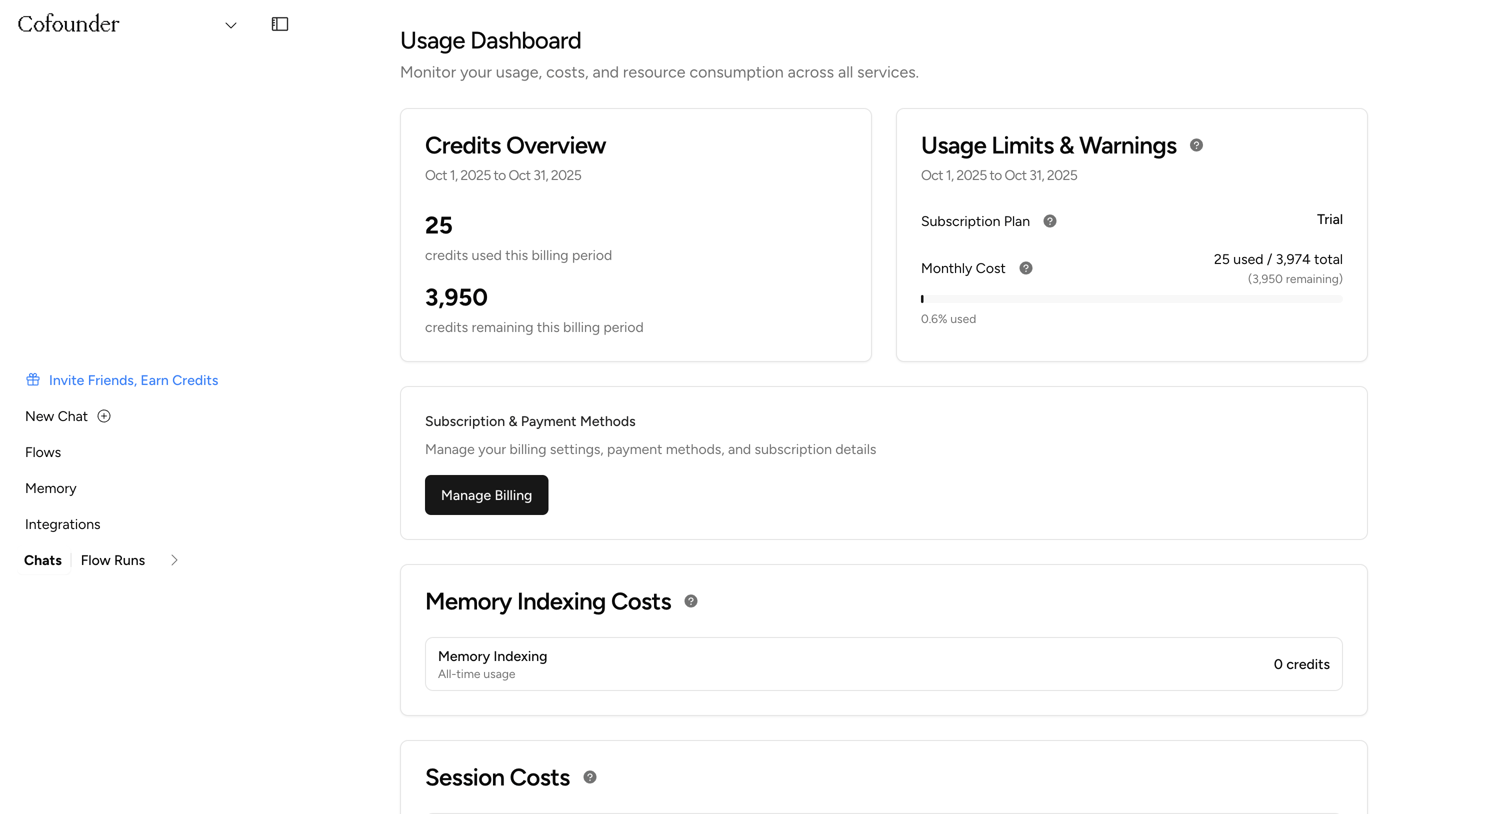
Settings dashboard where the user monitors their credit consumption, token usage, and session costs across the current billing period.
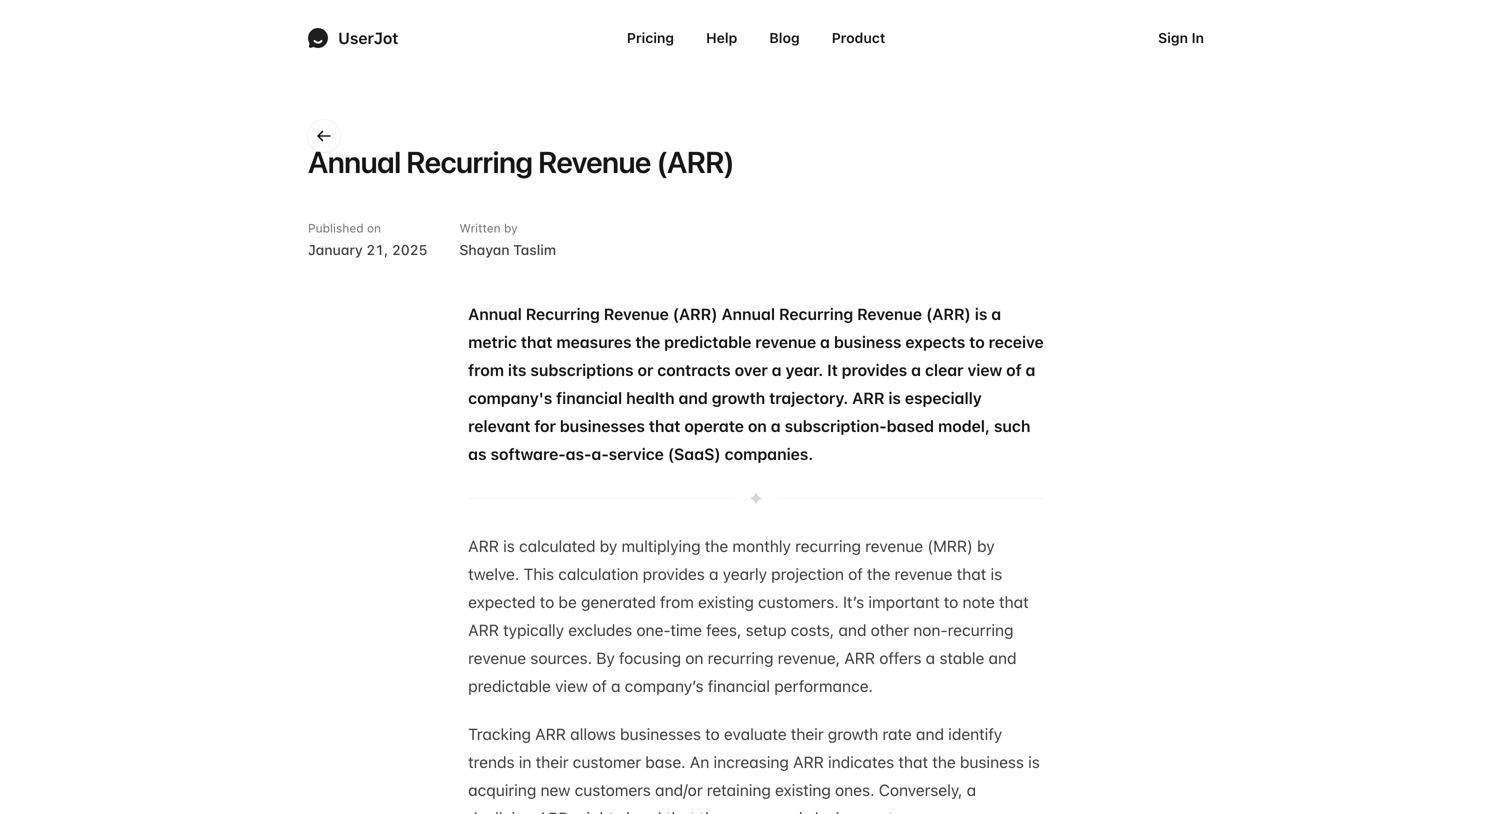

UserJot - Annual Recurring Revenue (ARR) - UserJot screen
UserJot logo
UserJot

Educational article defining Annual Recurring Revenue with author metadata, a detailed explanation, and a list of related glossary terms to read next.

Outseta - Engagement by Account screen
Outseta logo
Outseta

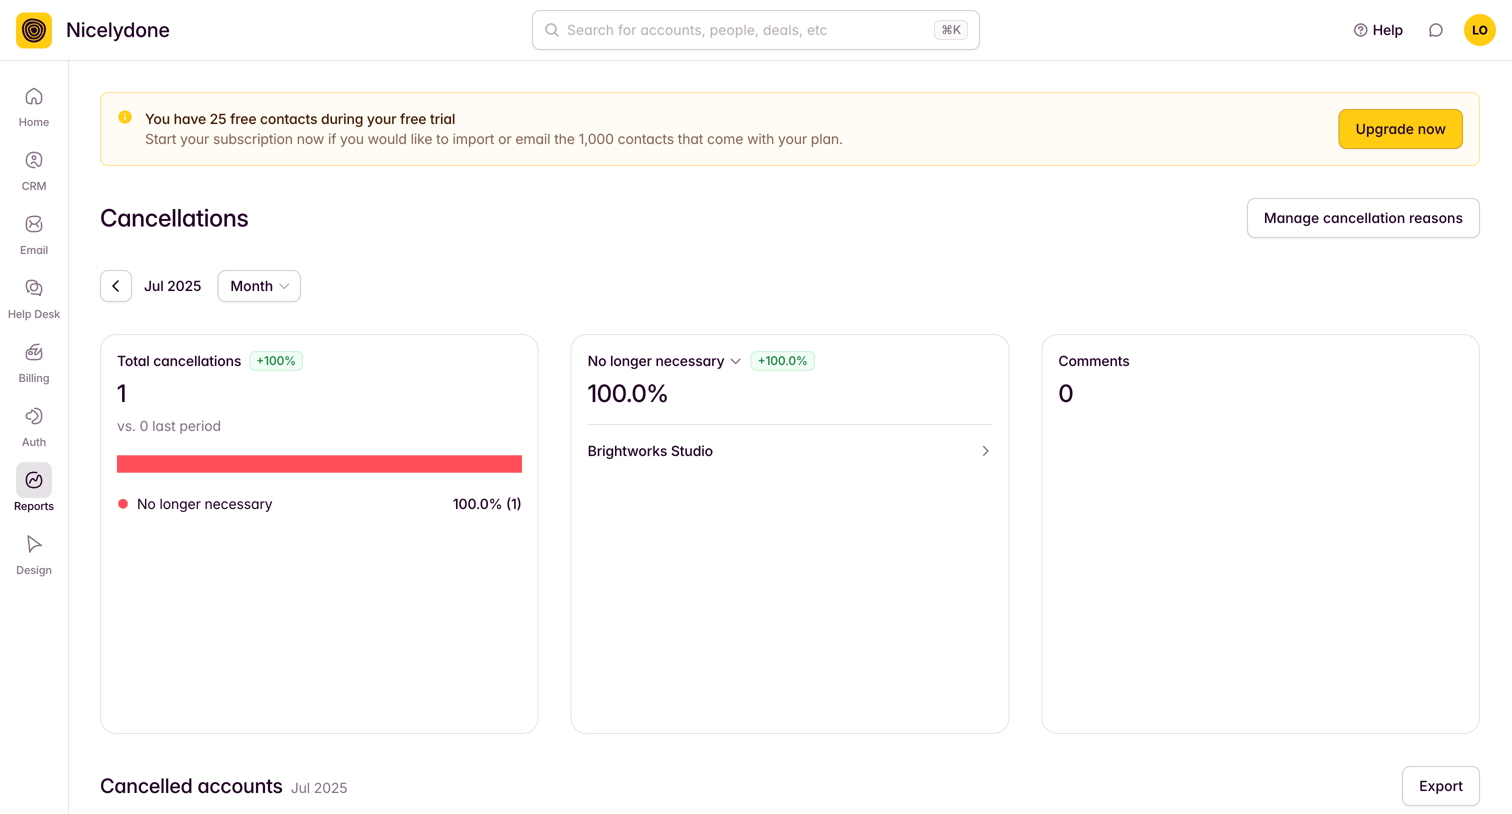
Dashboard showing cancellation metrics for July 2025, including a total churn count, a breakdown by reason, and a detailed list of cancelled accounts.

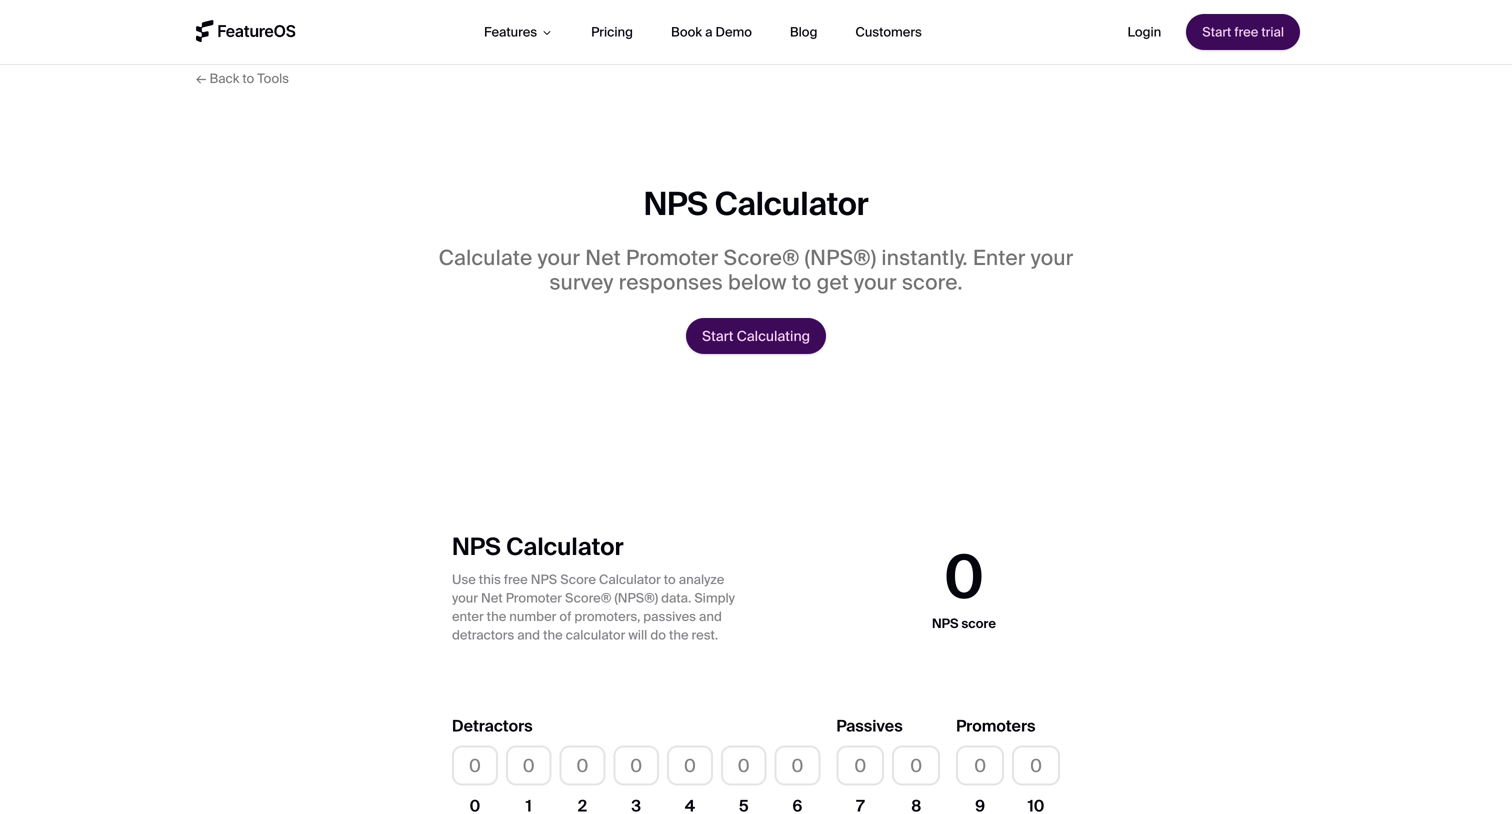
FeatureOS - Free NPS Calculator  Net Promoter Score Calculator - FeatureOS screen
FeatureOS logo
FeatureOS

Marketing tool page providing a free interactive calculator to determine Net Promoter Score from survey responses, alongside educational content explaining NPS benchmarks and best practices.
Midday - Overview | Midday screen
Midday logo
Midday

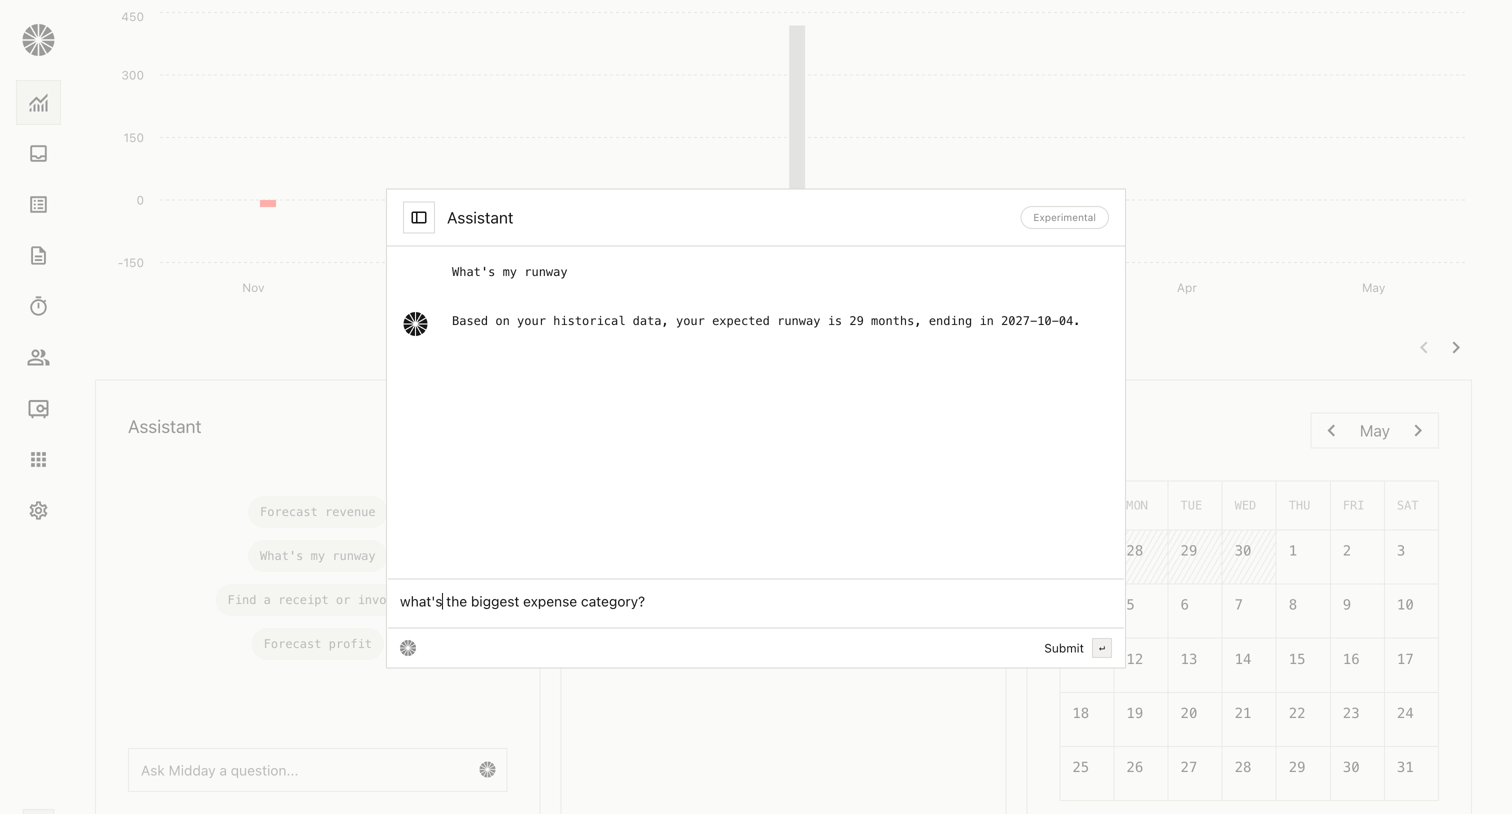
Financial dashboard featuring an open AI assistant overlay where the user is asking about their biggest expense category to analyze runway.

Supercut - Workspace screen
Supercut logo
Supercut

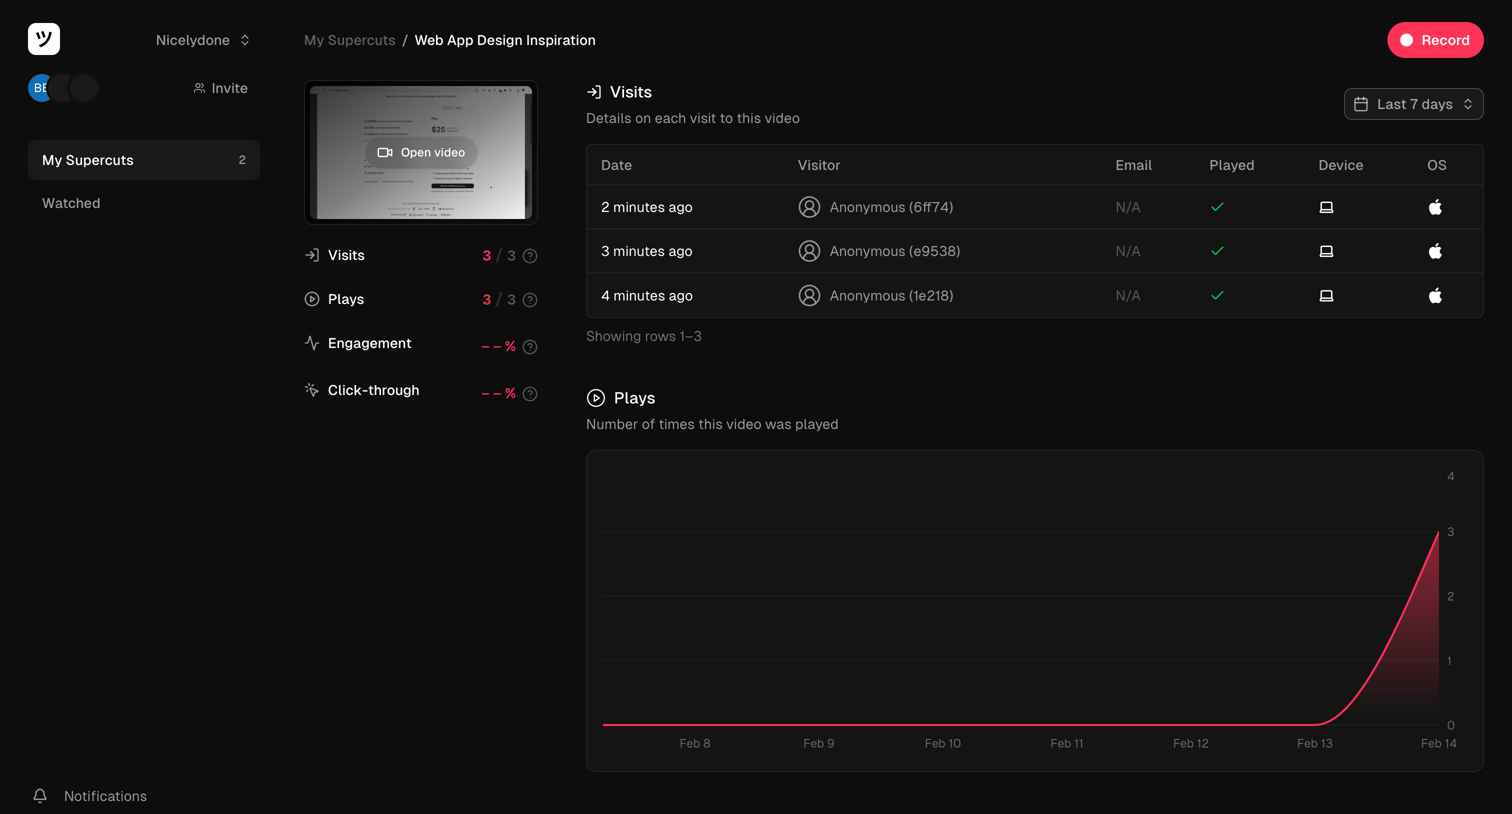
Dashboard showing detailed analytics for a specific video, including individual visitor logs, plays over time, and placeholder engagement metrics.

Steep - Cancelled orders screen
Steep logo
Steep

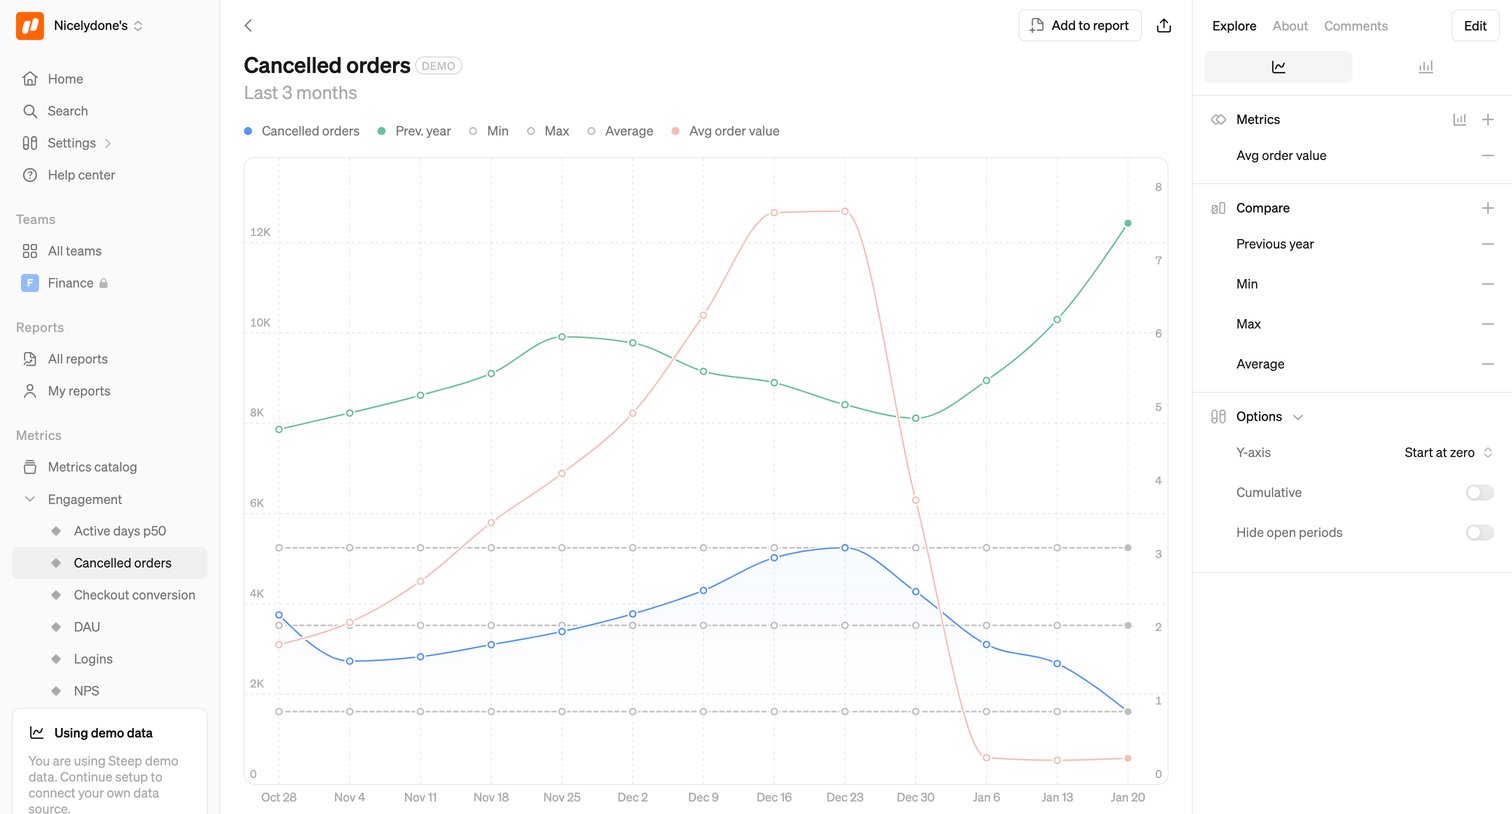
Detail page where the user explores a specific metric with a line chart, comparing it to previous periods and applying different statistical functions.

Explore the full SaaS screen library

Upgrade to unlock the full library.

Trusted by the best teams