Skip to content

Data analytics screen examples

Data analytics screen design examples from SaaS apps. Browse examples from Axiom, Dock, Exa.

Explore the examples
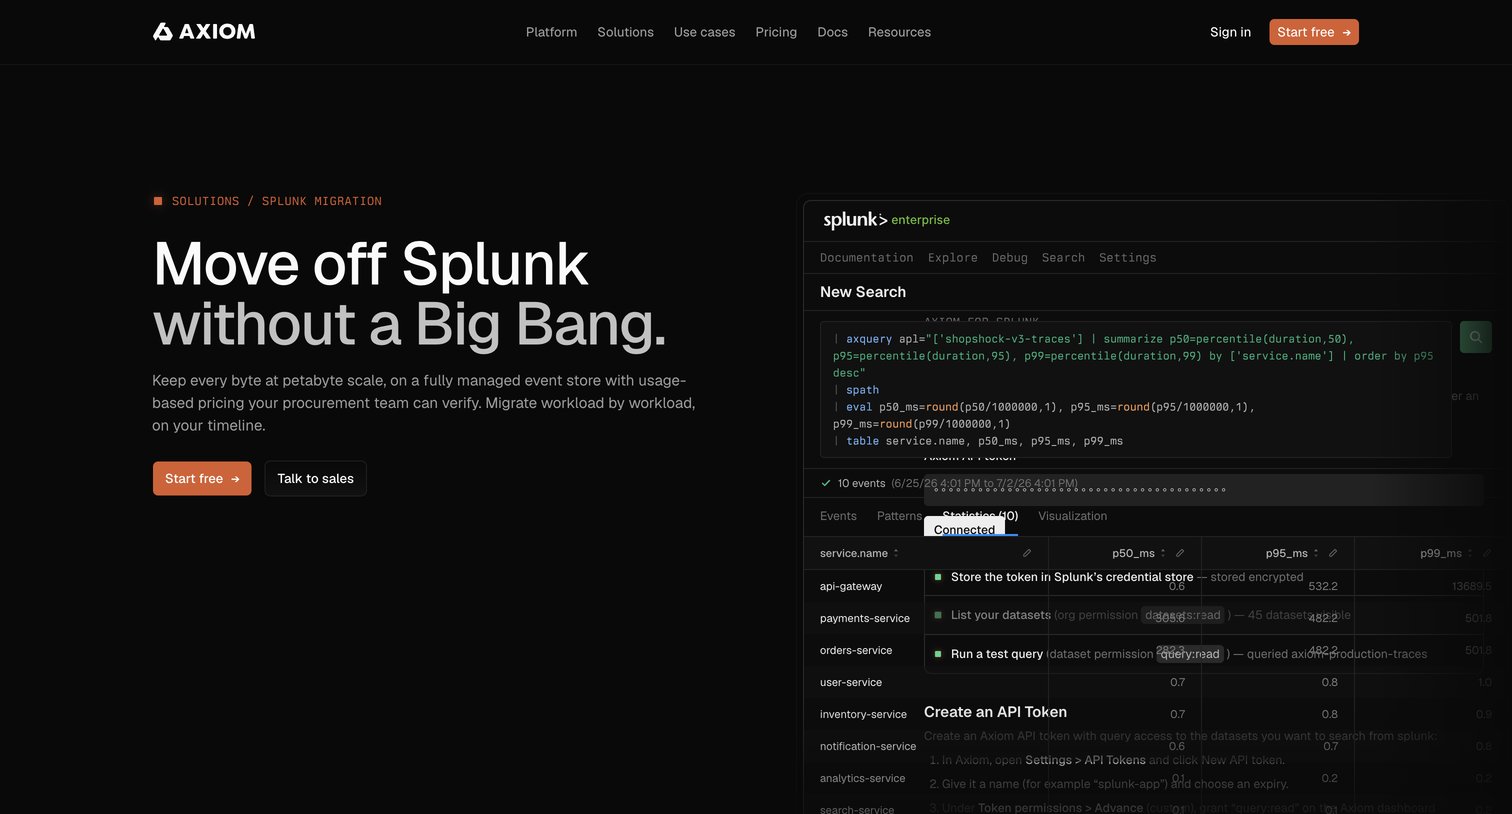
Axiom - Move off Splunk without a Big Bang - Axiom screen
Axiom logo
Axiom

Marketing page detailing the process, benefits, and alternatives for migrating from Splunk to Axiom, featuring comparison points and an FAQ.
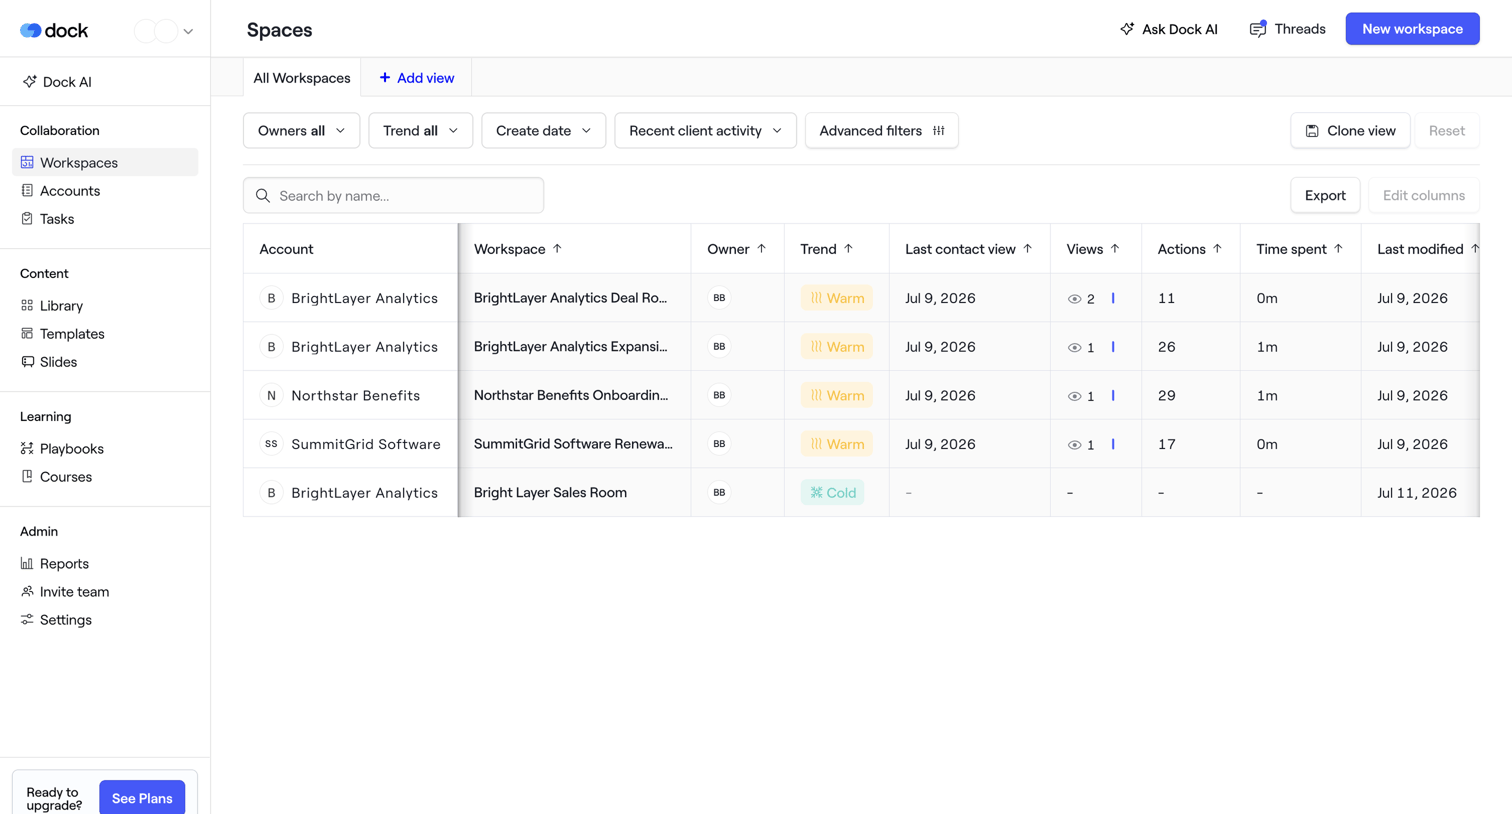

Dock - Spaces · Dock screen
Dock logo
Dock

List view where the user manages client workspaces, filtering by owner, trend, and recent activity.
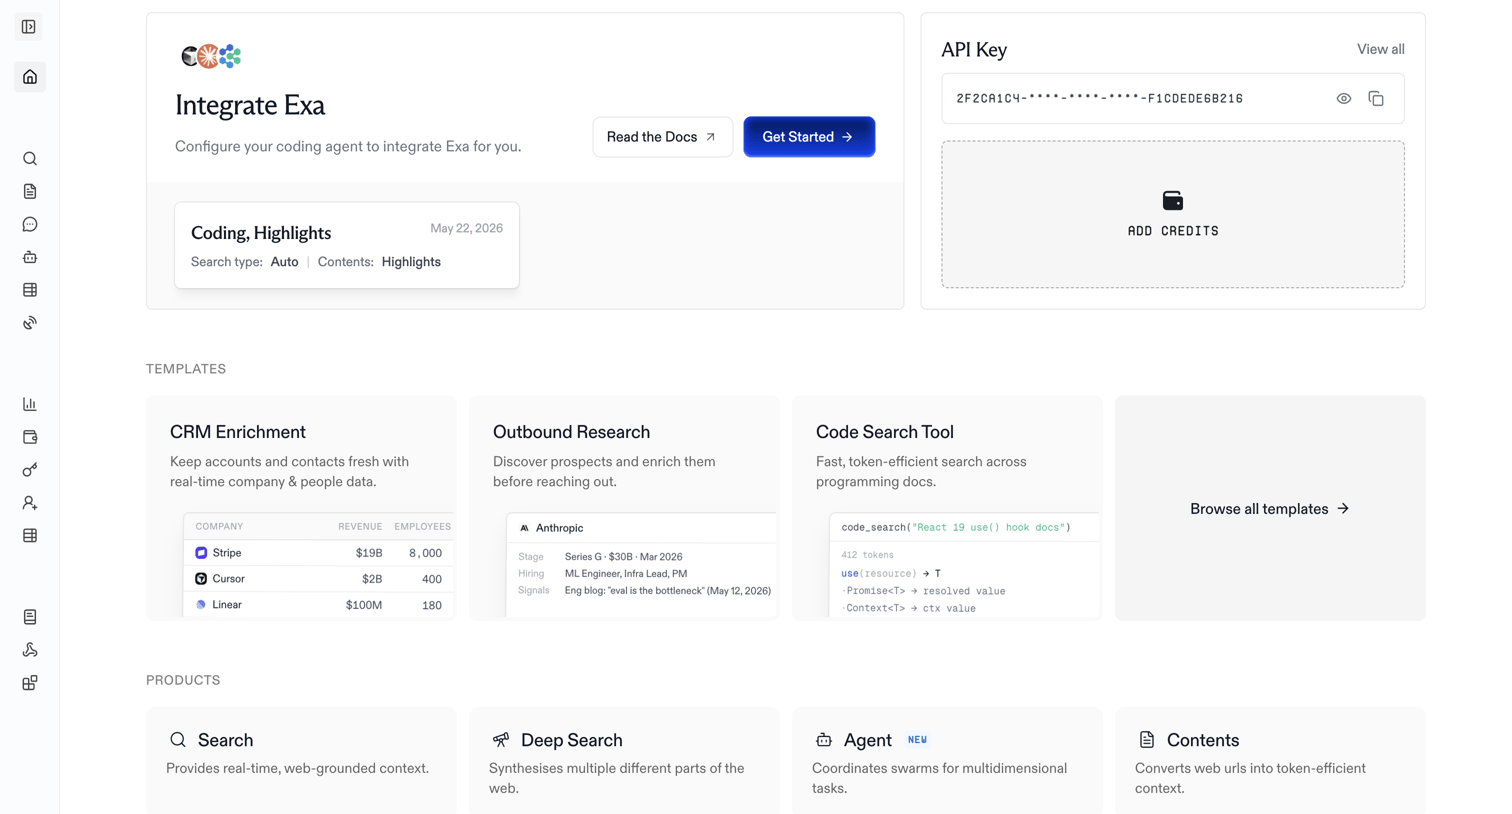

Exa - Home | Exa API screen
Exa logo
Exa

Home dashboard where the user can copy their API key, view product templates like CRM Enrichment, and explore available AI search capabilities.

Navattic - Builder - Untitled Flow screen
Navattic logo
Navattic

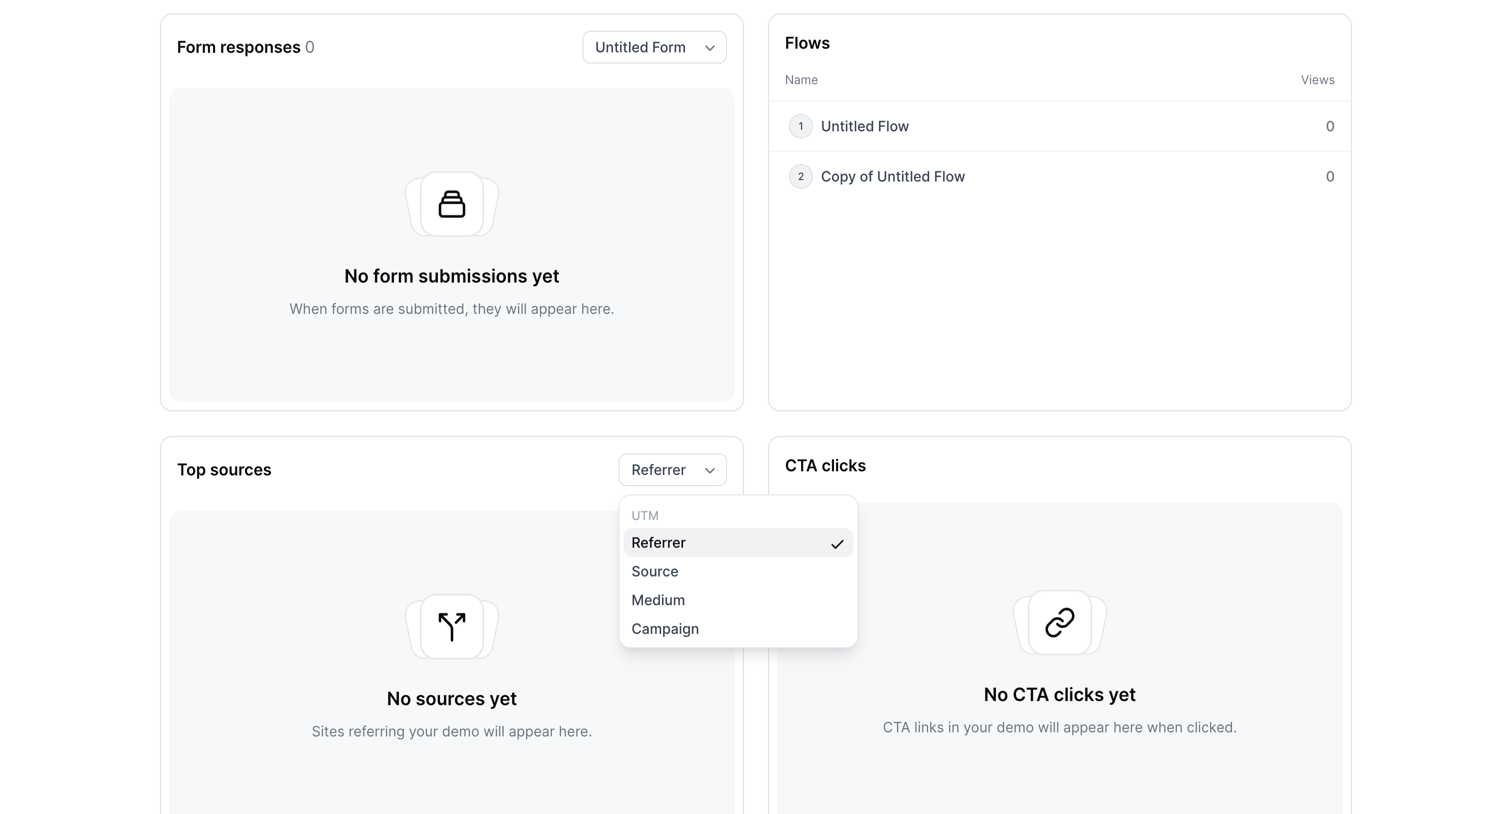
Dashboard showing empty states for form responses, top sources, and CTA clicks, along with a list of flows with zero views.

Dovetail - Dovetail | Customer Intelligence Platform screen
Dovetail logo
Dovetail

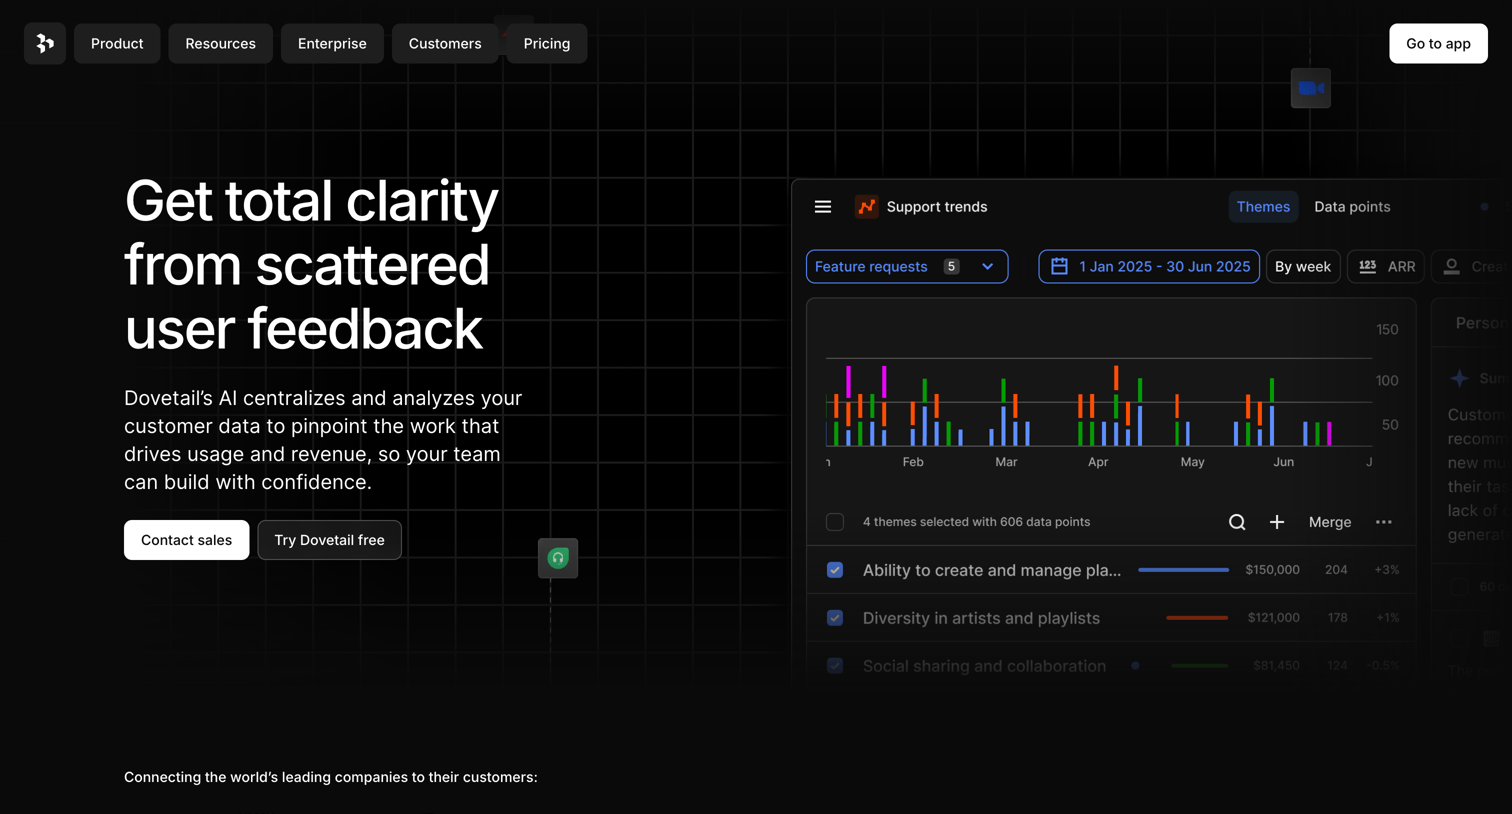
Landing page hero section pitching an AI-powered user feedback analysis tool, featuring a product UI mockup showing support trends and theme analysis.
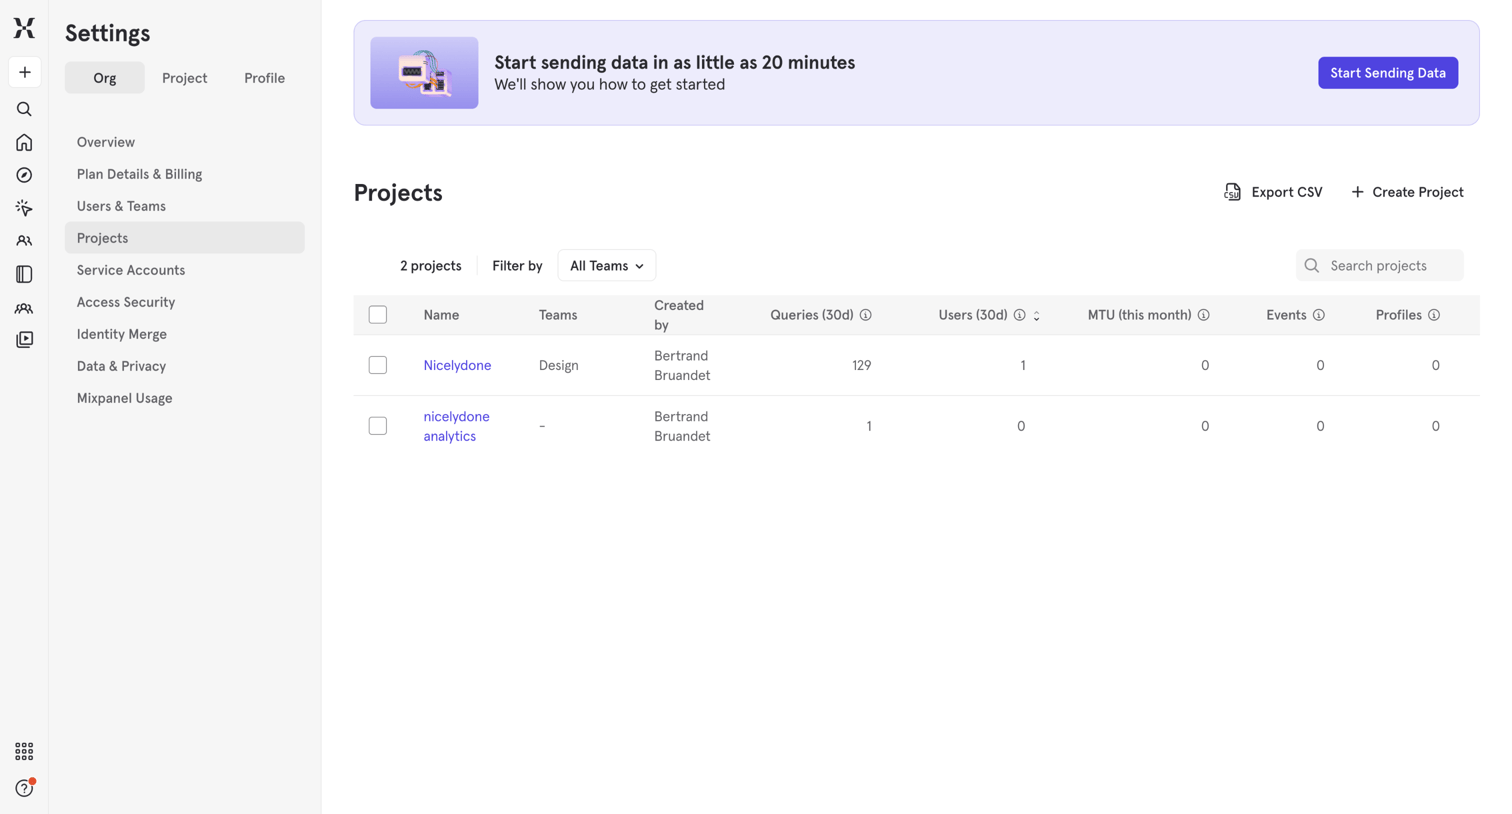

Mixpanel - Mixpanel - Product Analytics screen
Mixpanel logo
Mixpanel

Settings page where the user manages organization projects, viewing usage metrics like queries and events, and can create new projects or export data.

Attio - Dashboards - Attio screen
Attio logo
Attio

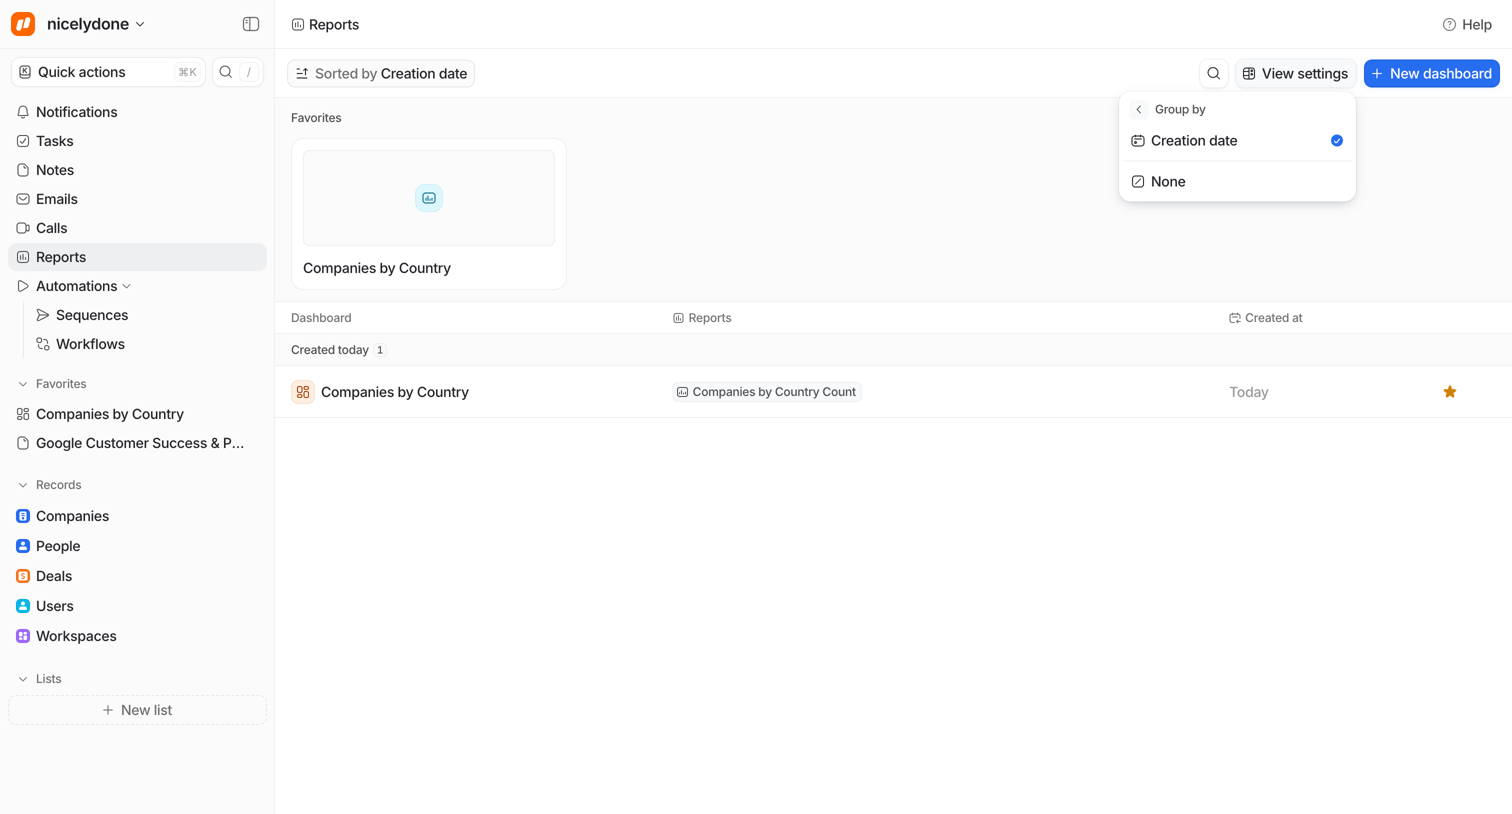
Reports page where the user views favorite dashboards like 'Companies by Country' and a list of reports grouped by creation date.

Firecrawl - Dashboard | Firecrawl screen
Firecrawl logo
Firecrawl

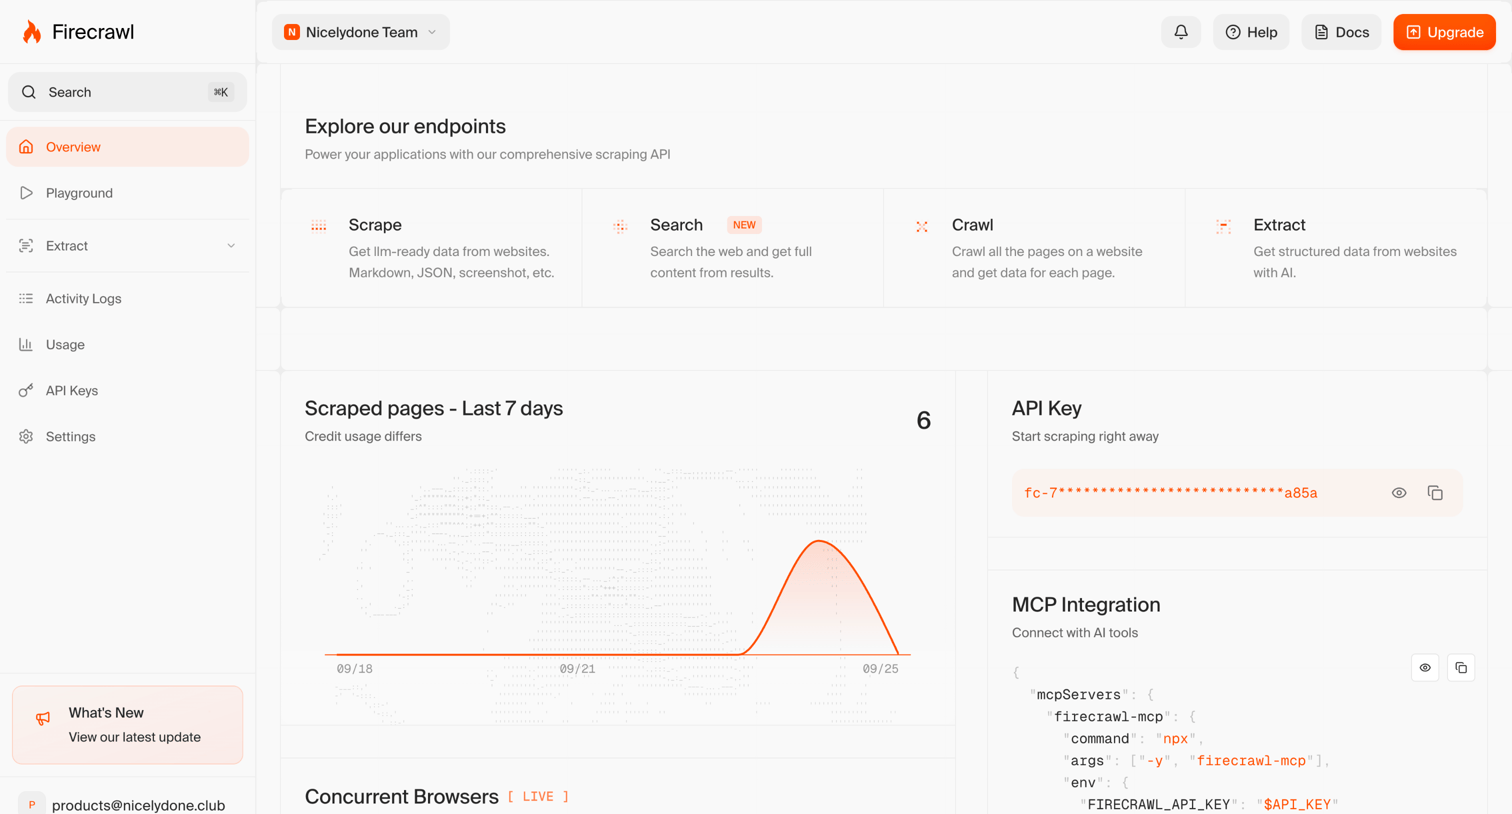
Dashboard showing API endpoint shortcuts, a 7-day usage chart, active API keys, and MCP integration code.

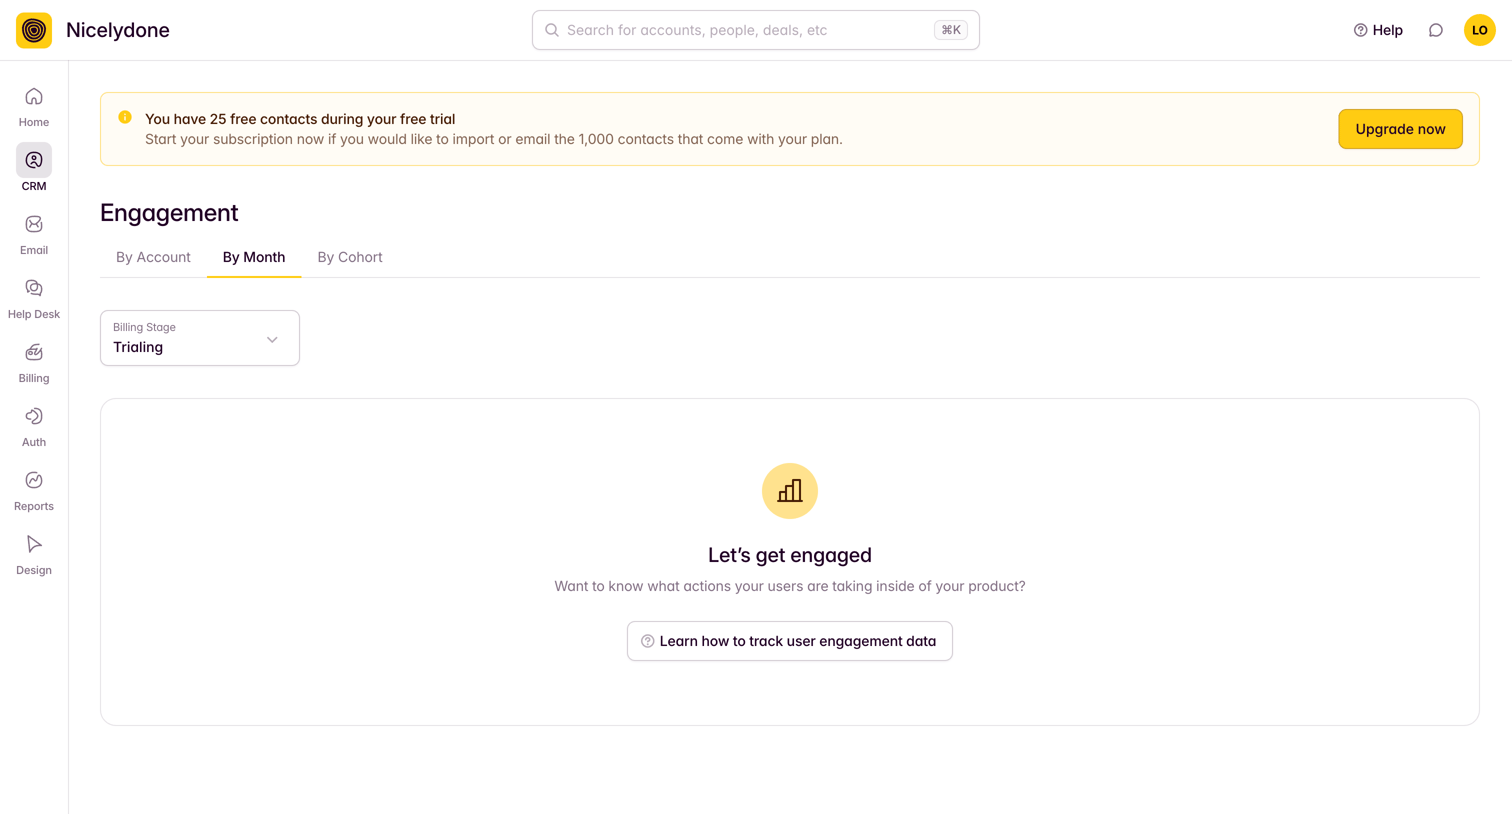
Outseta - Engagement by Month screen
Outseta logo
Outseta

Dashboard empty state for user engagement tracking, featuring a trial status banner and options to view data by account, month, or cohort.
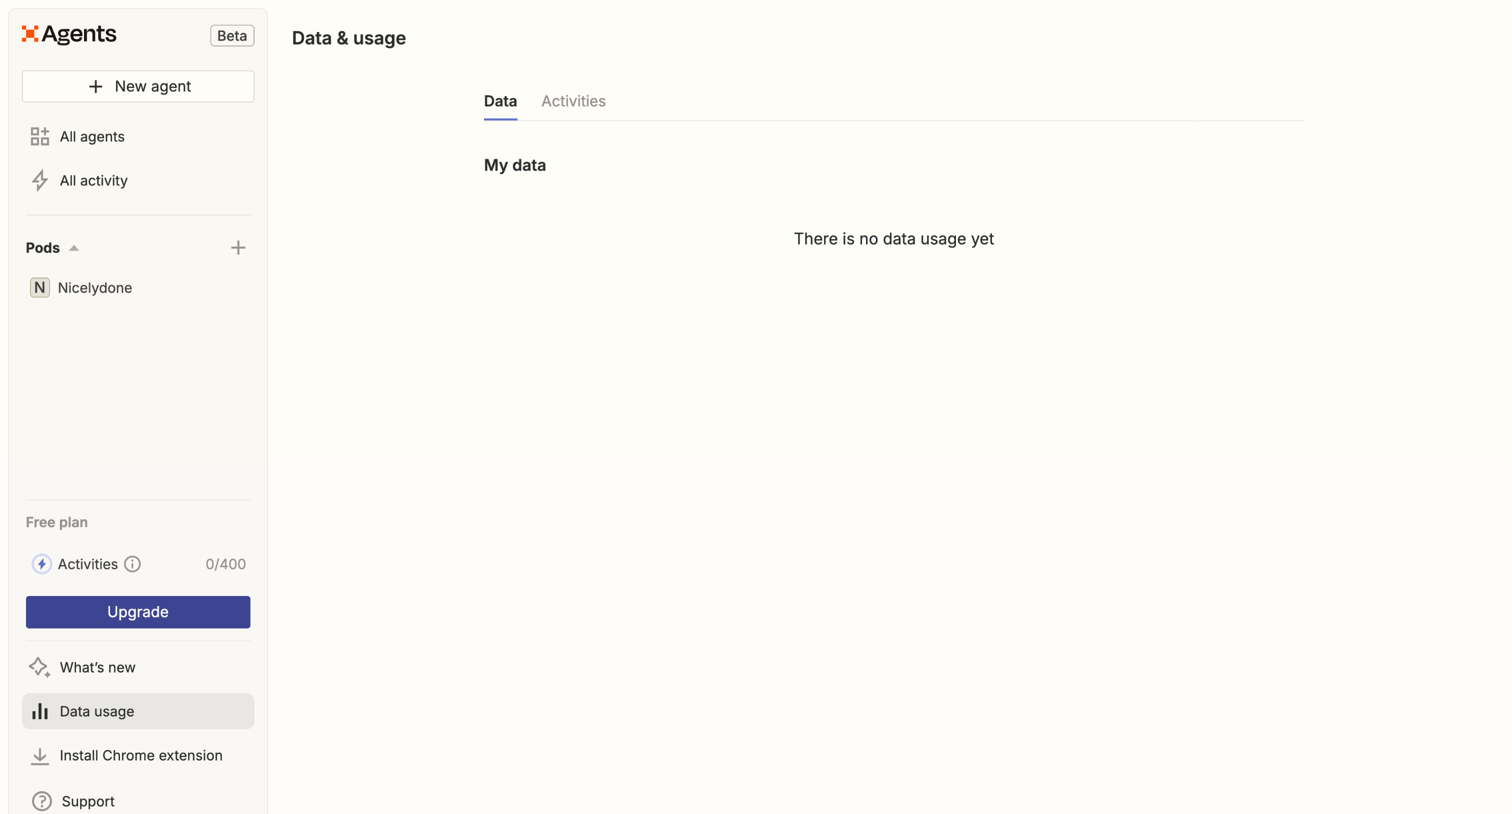

Zapier - Data & usage | Zapier Agents screen
Zapier logo
Zapier

Settings page where the user tracks their data and activity usage against their free plan limits, currently showing an empty state.
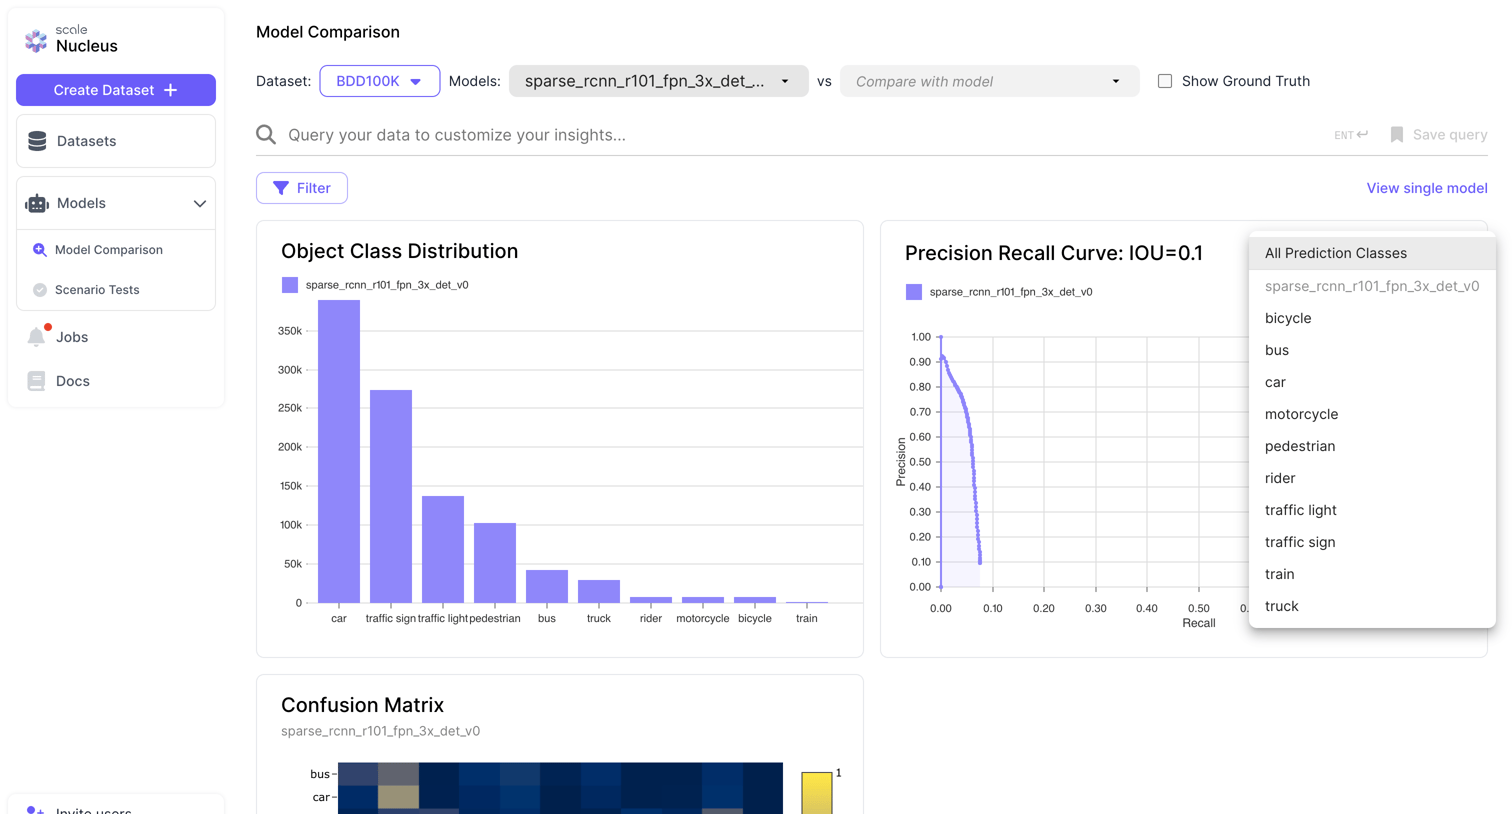

Scale - Model Comparison - Nucleus screen
Scale logo
Scale

Dashboard for comparing machine learning models, featuring dataset selection, model dropdowns, and charts for class distribution, precision-recall, and a confusion matrix.
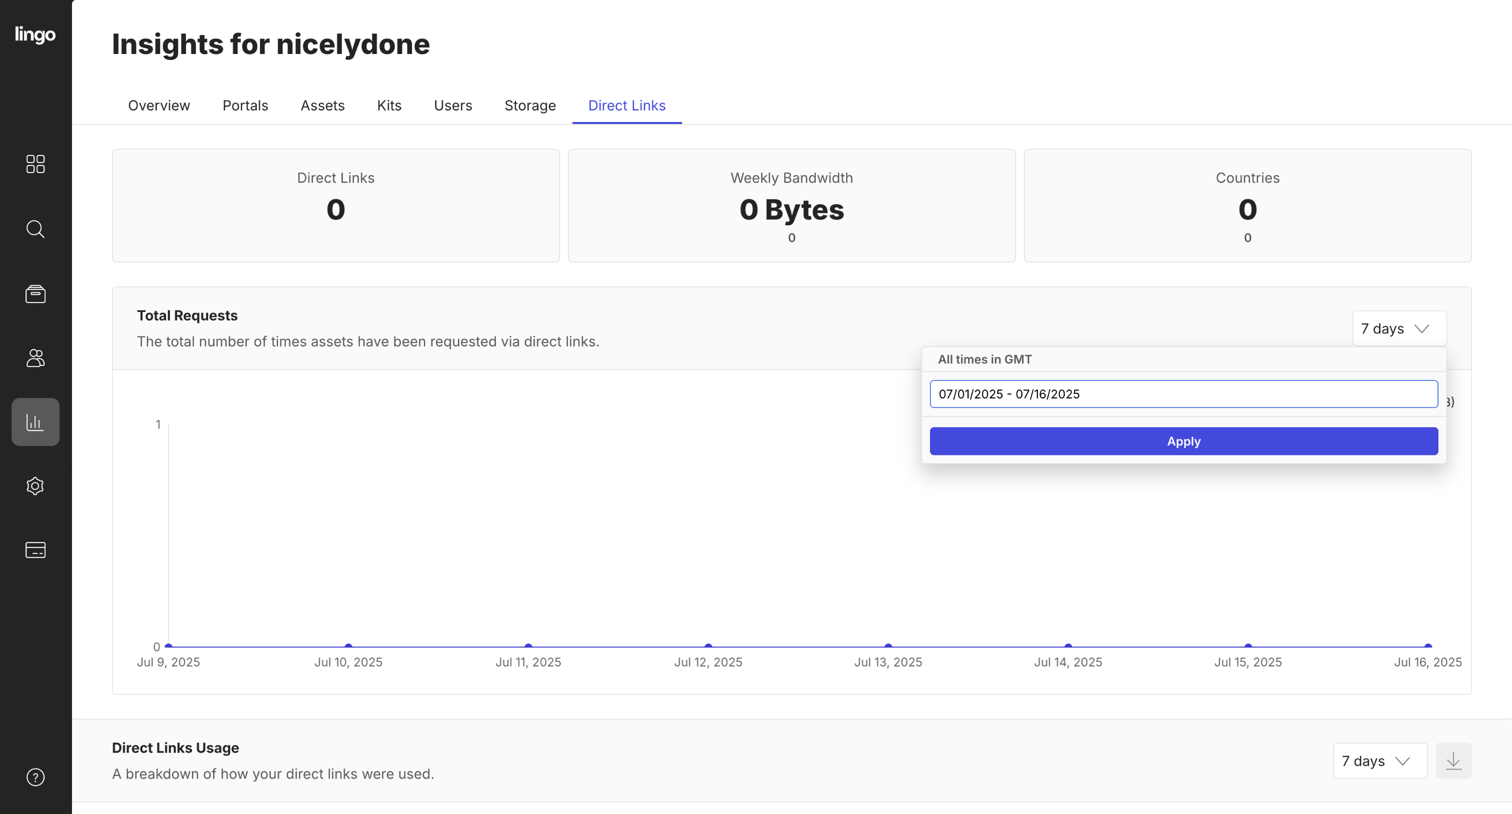

Lingo - nicelydone Insights screen
Lingo logo
Lingo

Dashboard showing usage metrics and an empty line chart for direct links requests over a selected date range.

Explore the full SaaS screen library

Upgrade to unlock the full library.

Trusted by the best teams