Performance metrics screen examples
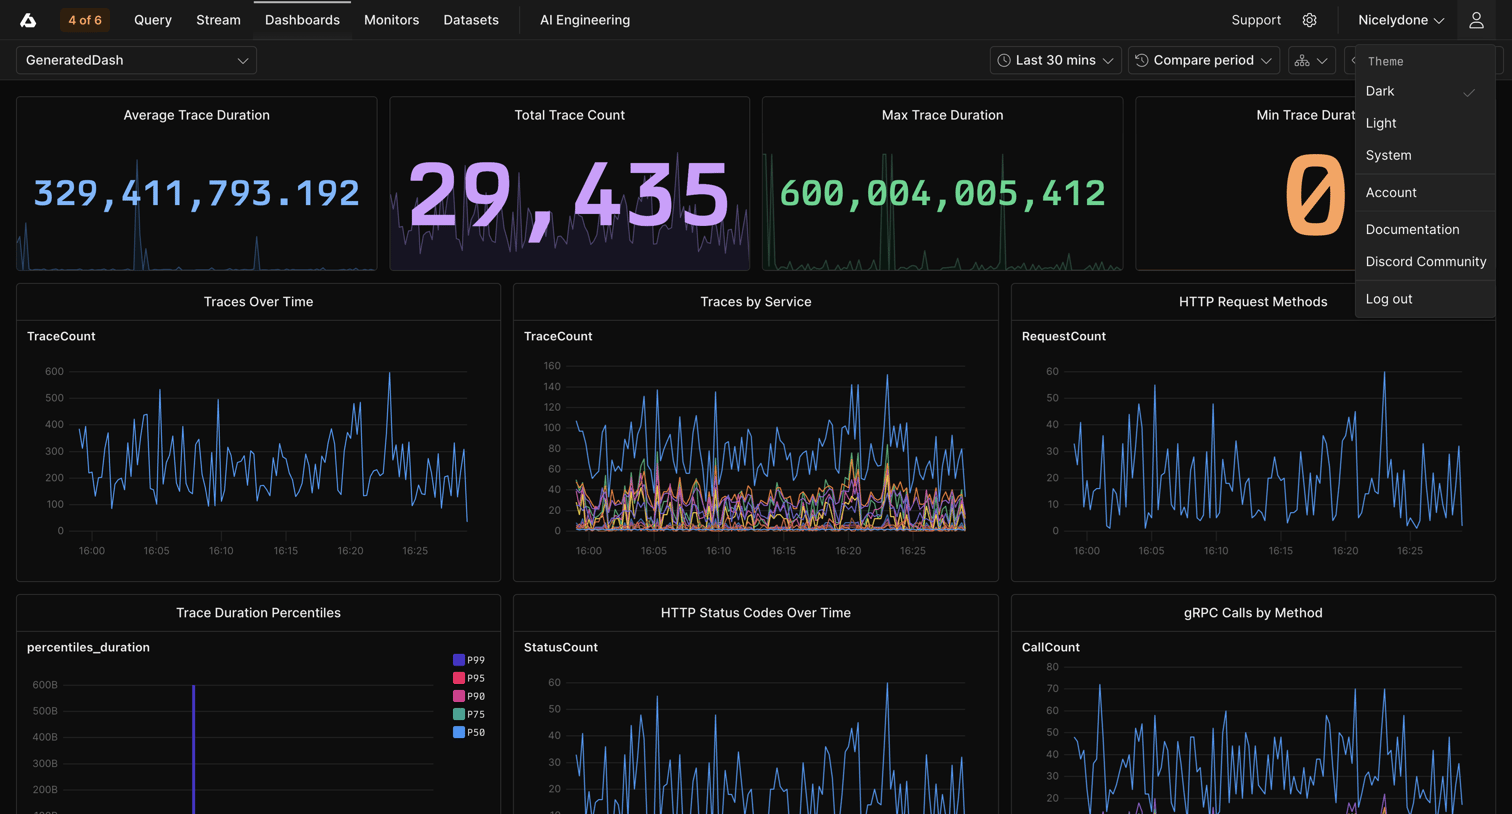
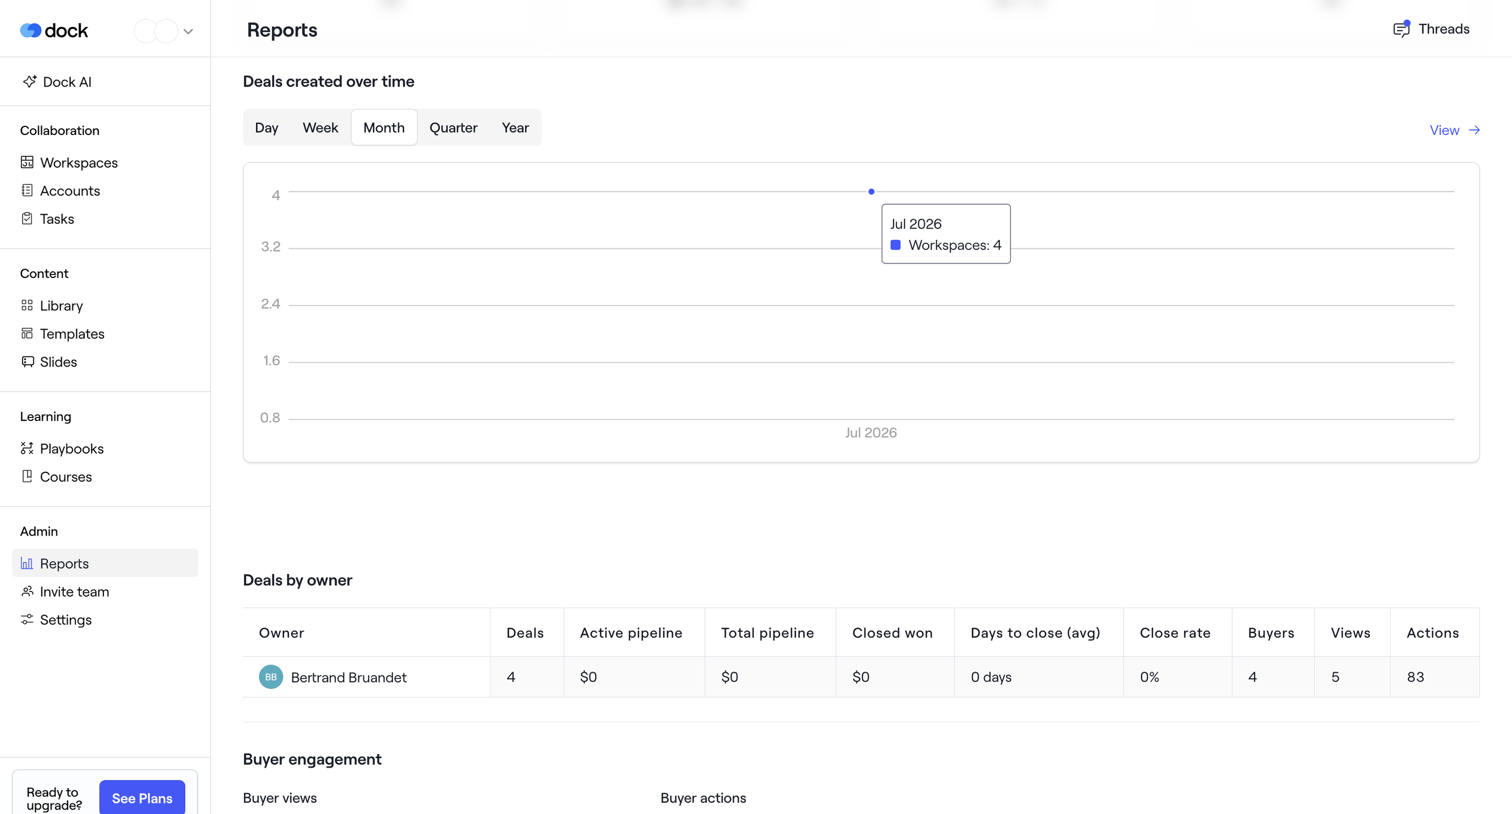
Performance metrics screen design examples from SaaS apps. Browse examples from Inference, Axiom, Dock.
Explore the examples
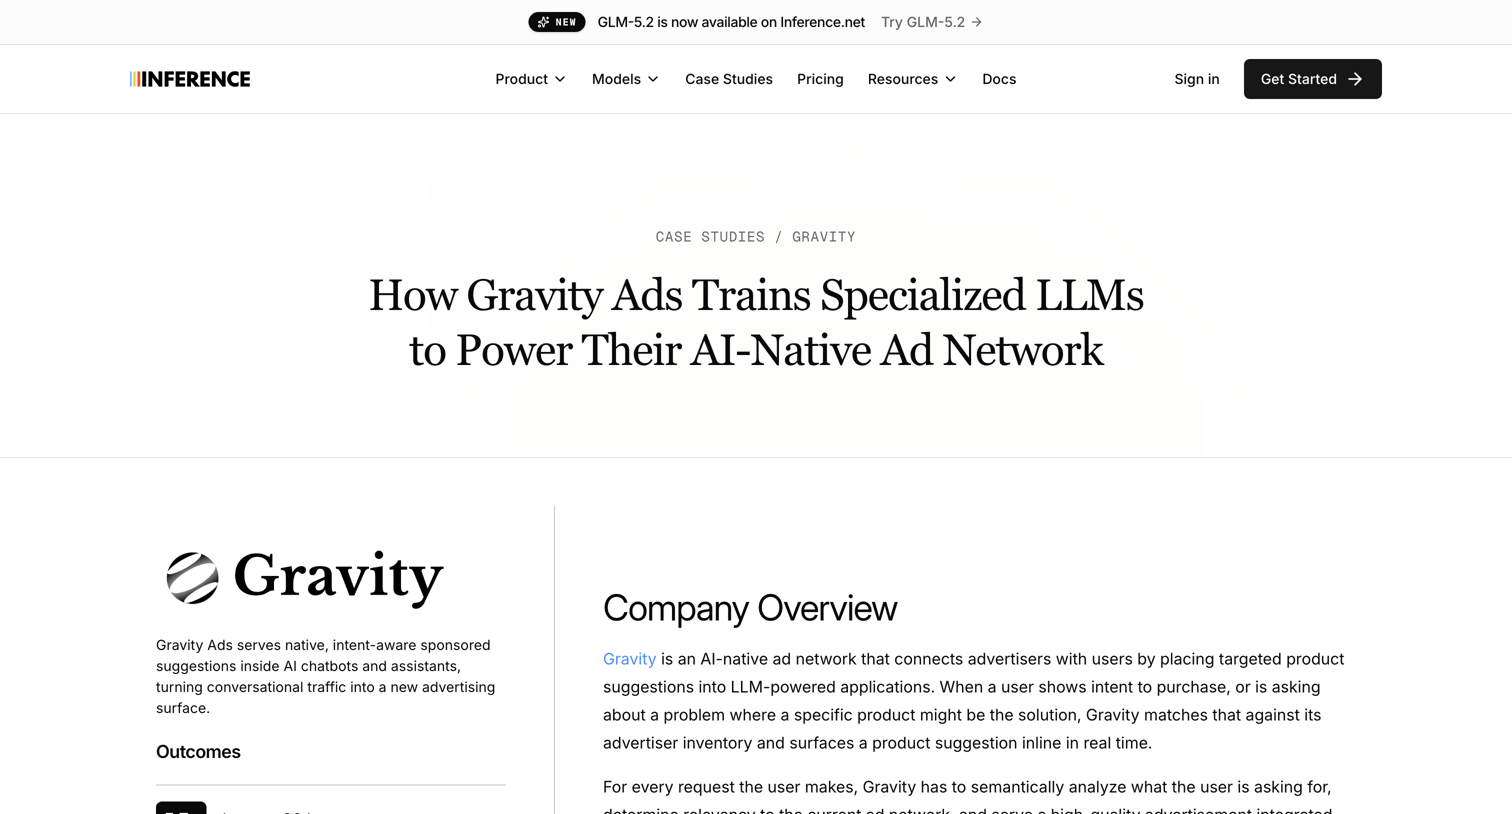

Customer story page detailing how Gravity Ads uses specialized LLMs to reduce latency, featuring outcome metrics, a performance comparison bar chart, and an embedded calendar to book a research meeting.


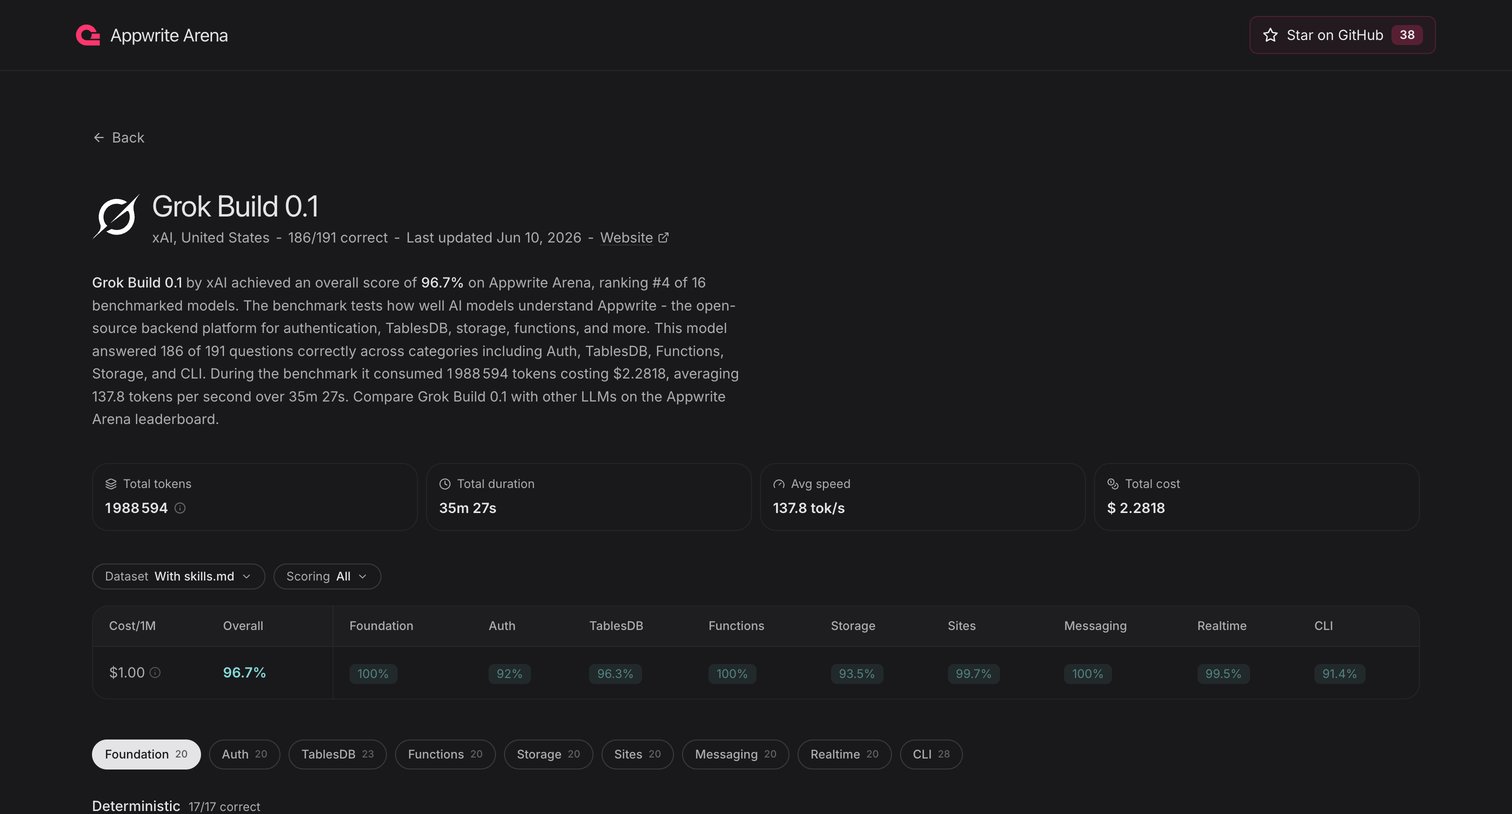

Tools page displaying detailed benchmark performance, cost metrics, and category scores for the Grok Build 0.1 AI model.
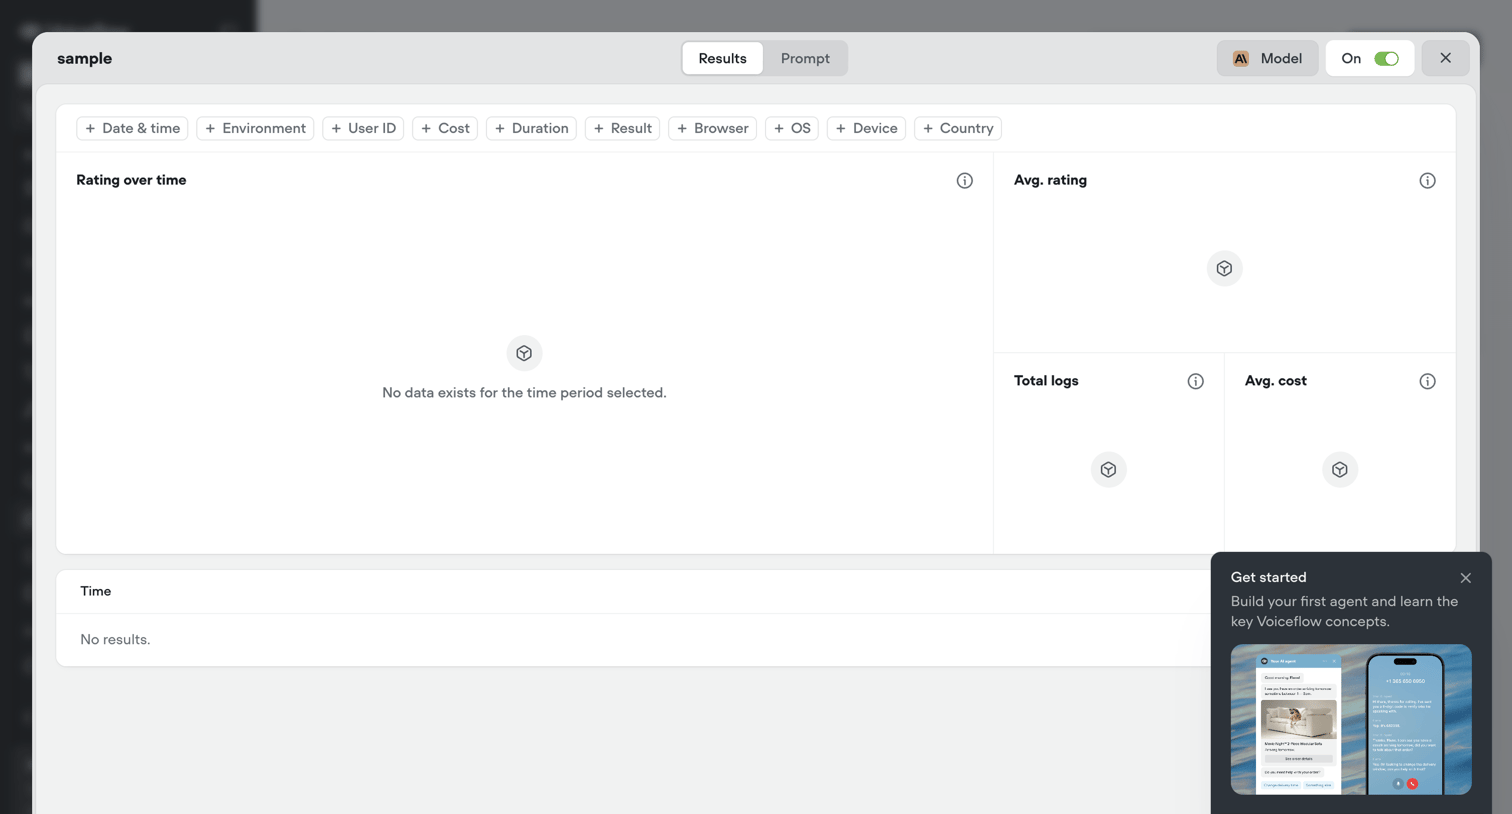

Evaluations dashboard overlay showing empty states for rating, logs, and cost metrics, along with an onboarding popover prompting the user to build their first agent.
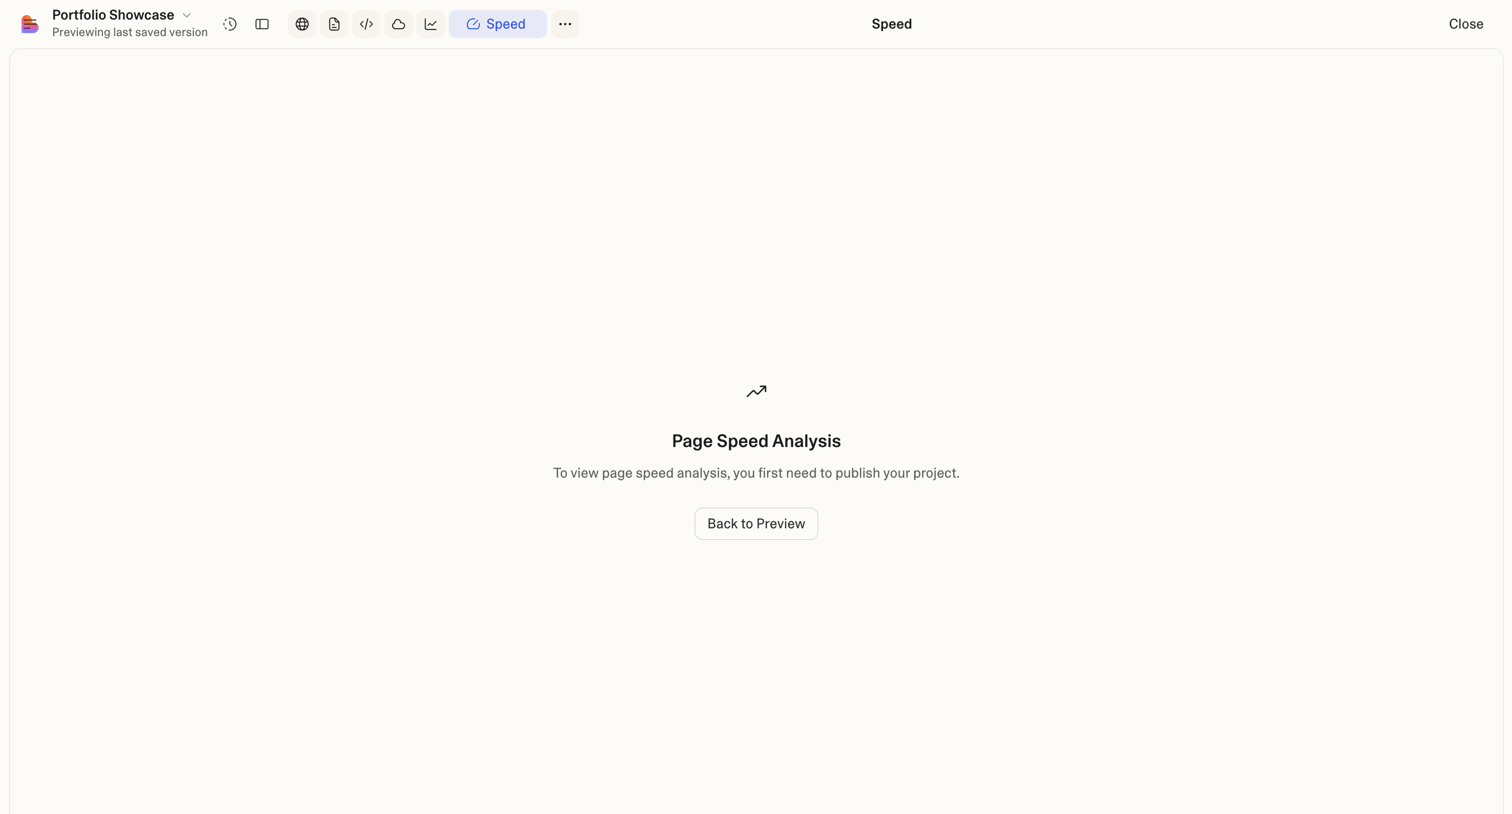

Analytics view where the user is prompted to publish their project before viewing page speed analysis.
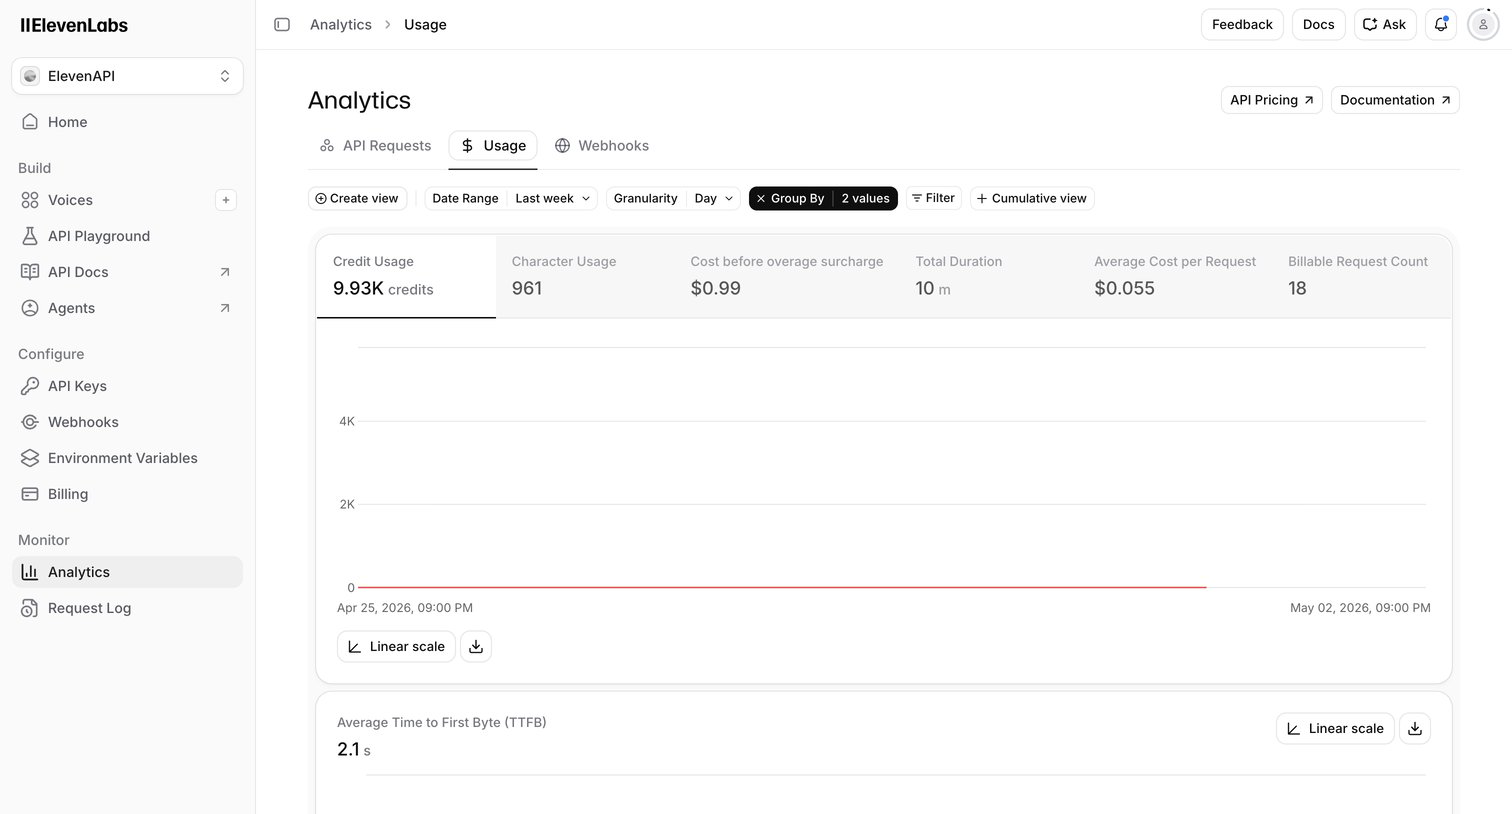

Dashboard showing API usage metrics including credit usage, character usage, and average cost per request over time, with filters for date range and granularity.
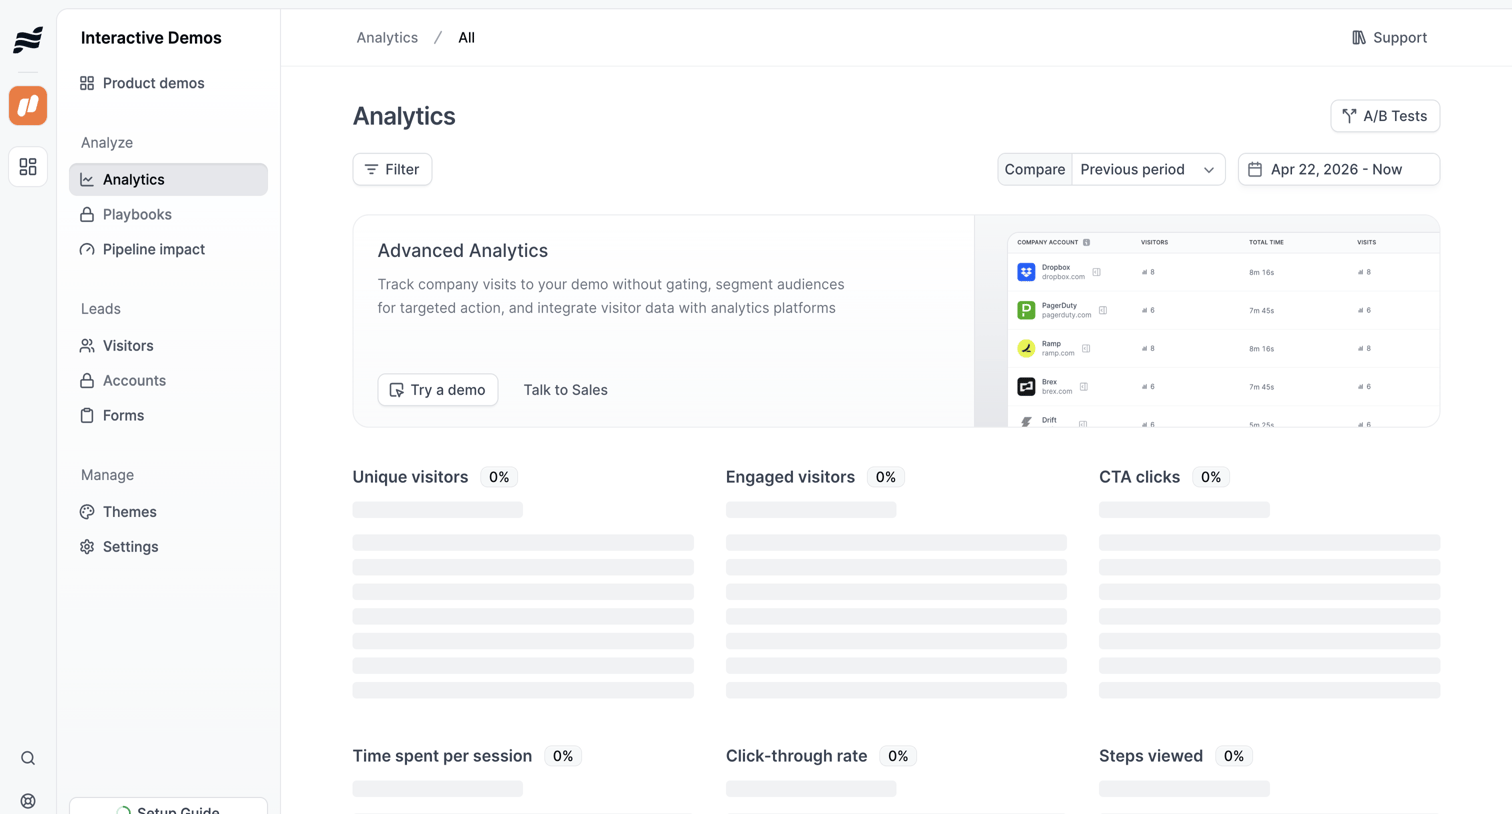

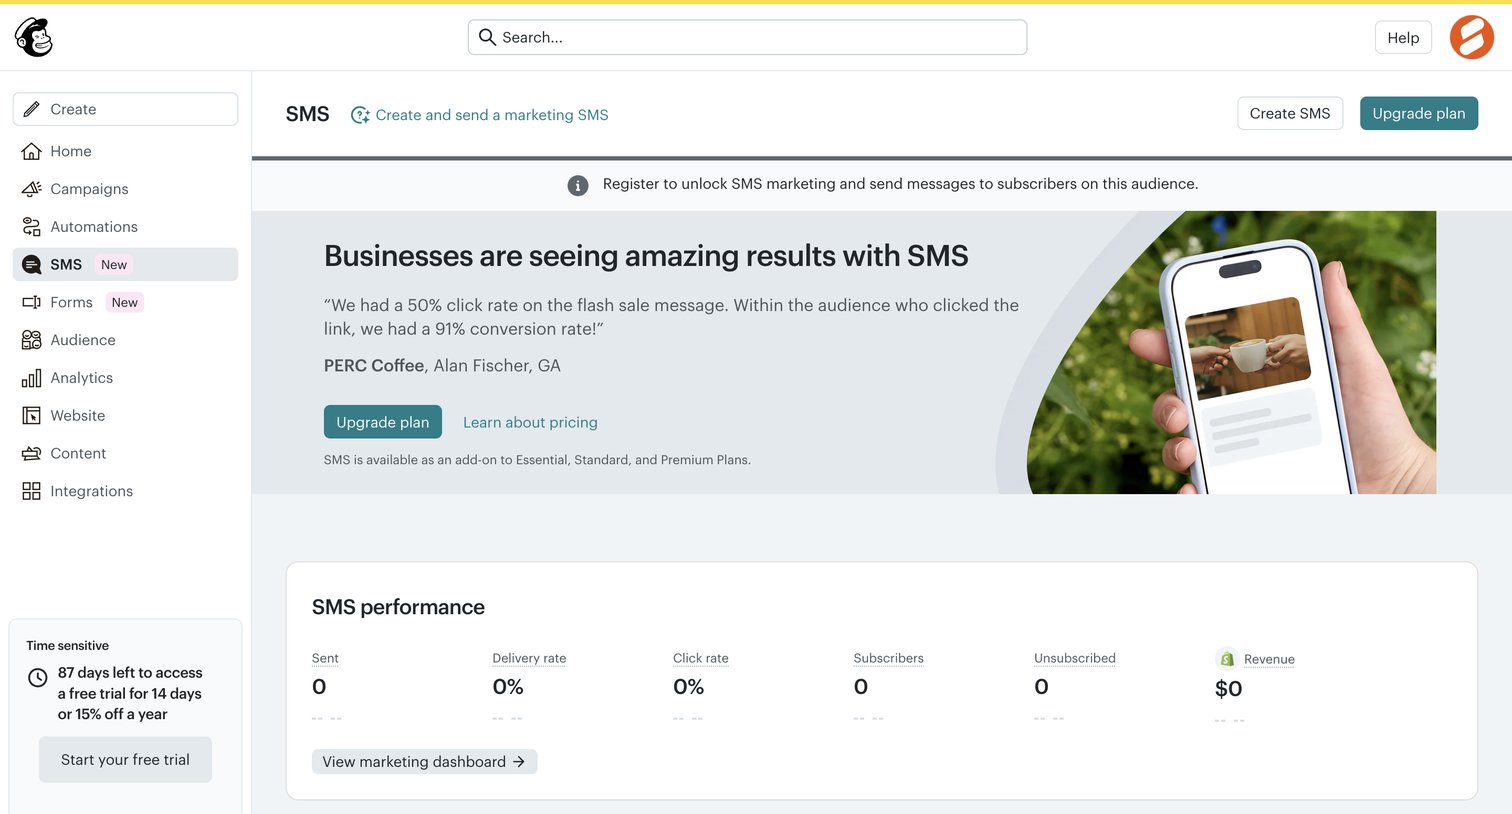

Dashboard for SMS marketing that prompts the user to upgrade their plan to unlock the feature, showing an empty performance metrics card below a promotional banner.
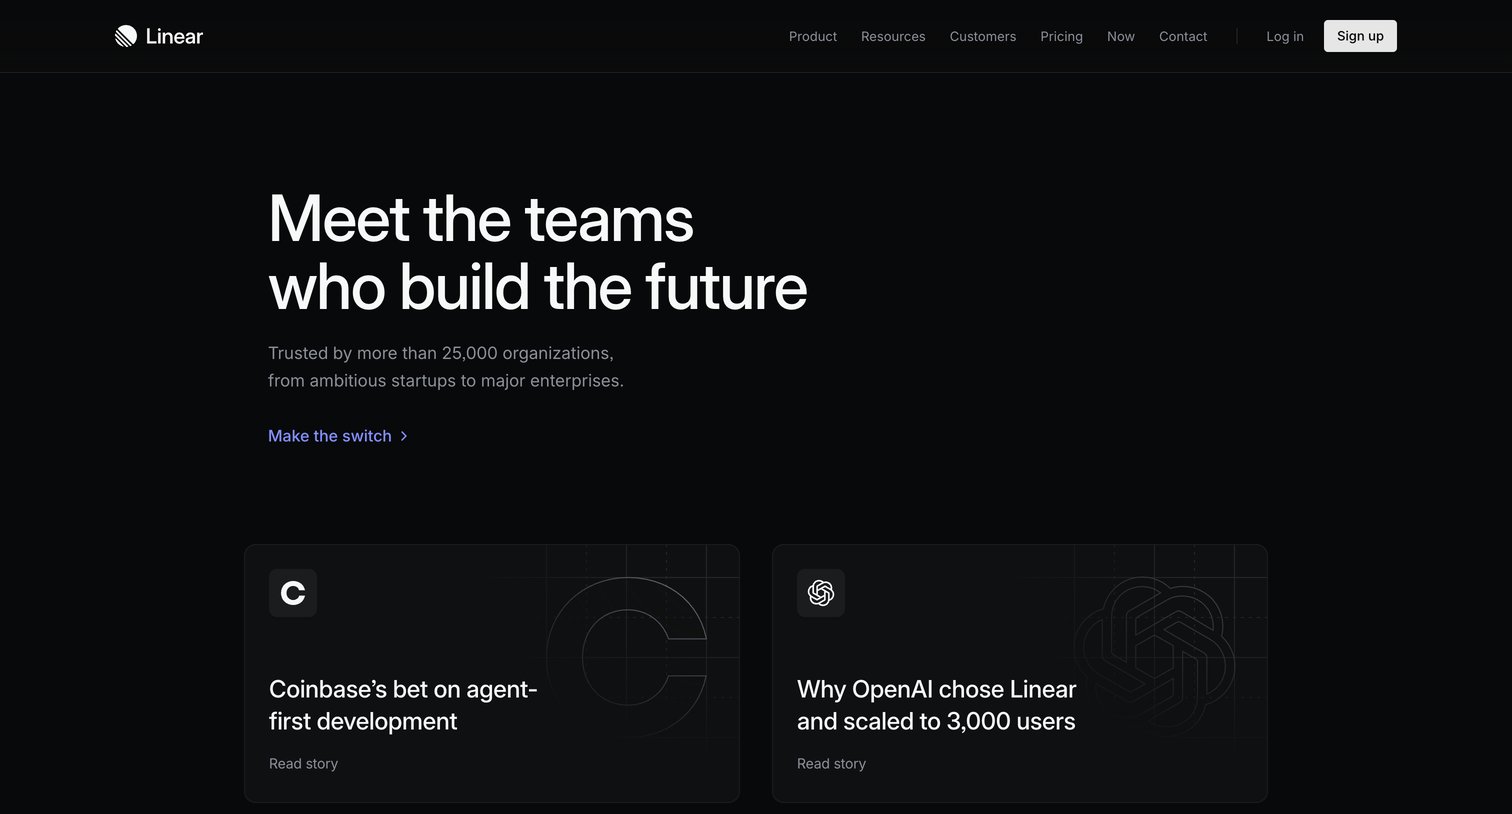

Customer showcase page featuring case study cards, aggregate performance metrics, and a filterable directory of companies using the product.
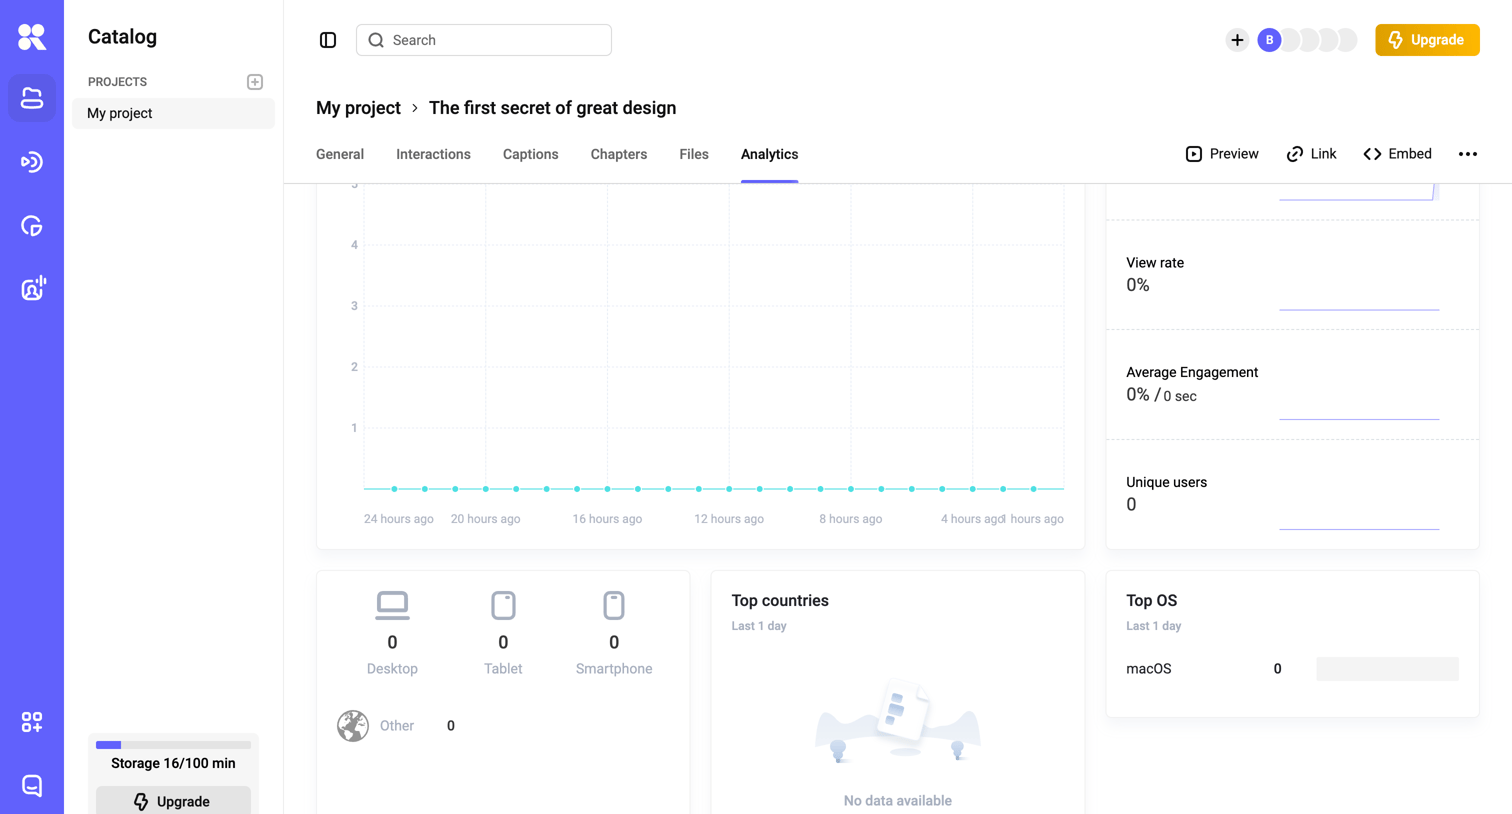

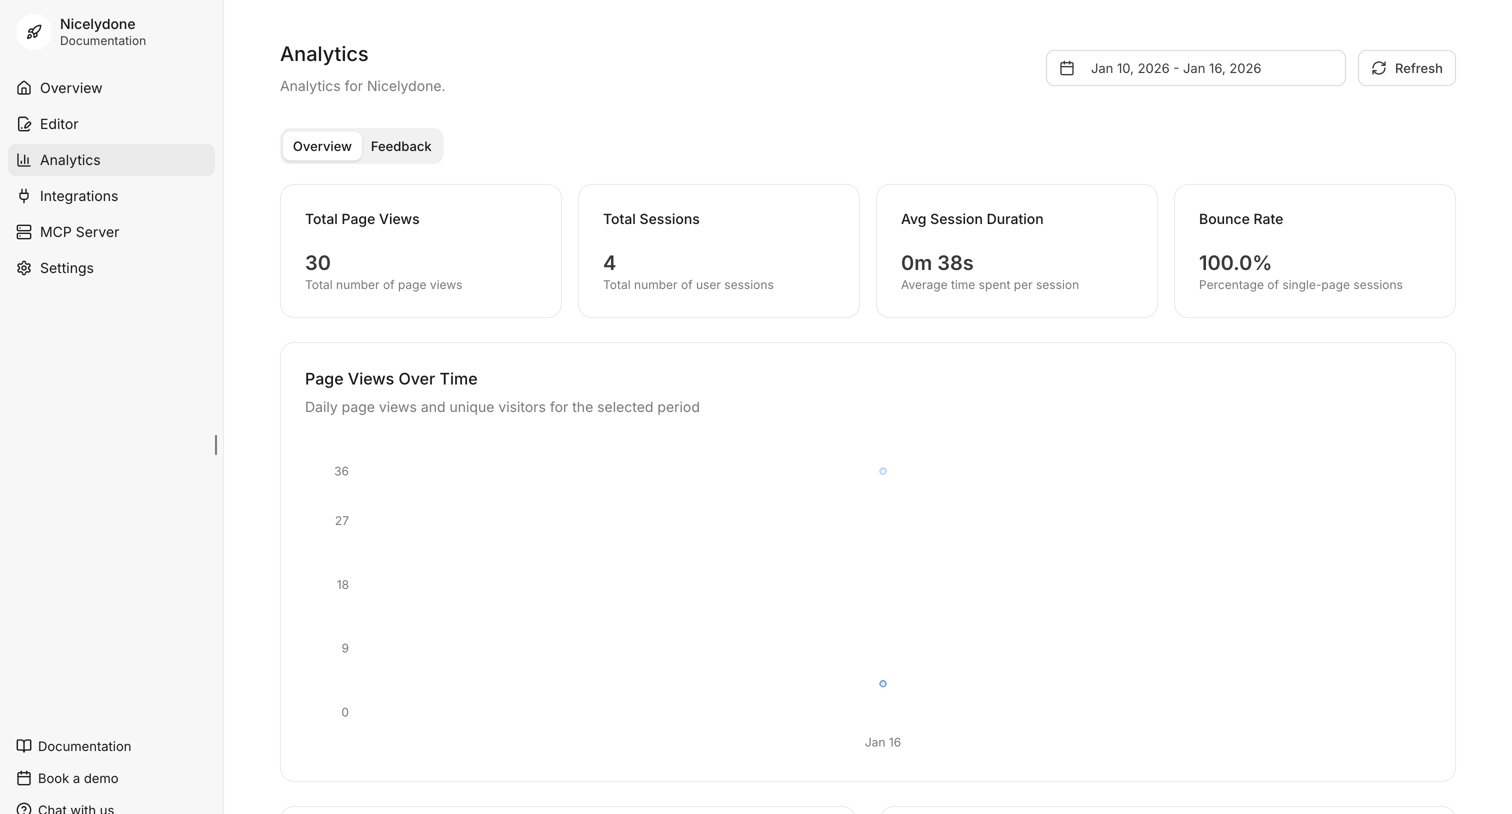

Dashboard showing documentation analytics with KPI tiles for page views and sessions, along with a date-filtered line chart.
Explore the full SaaS screen library
Upgrade to unlock the full library.
Trusted by the best teams







