Skip to content

Vercel UI components examples

Browse Vercel UI component design examples. Preview individual interface elements and explore related component categories. Develop. Preview. Ship.

Explore the examples
Vercel — Flyout menu component
Vercel logo
Vercel

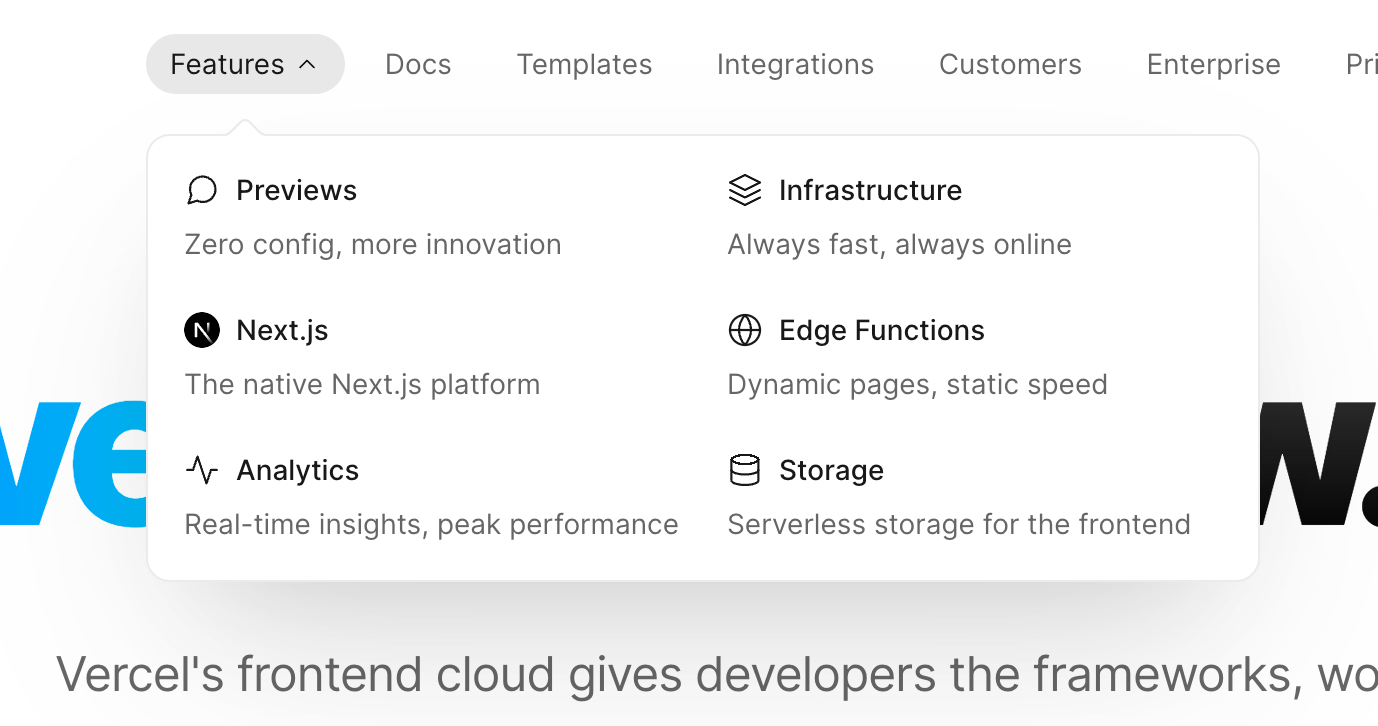
A navigation bar with an expanded 'Features' dropdown menu. The dropdown displays a grid of feature categories, each with an icon, title, and short description.

Vercel — Alert component
Vercel logo
Vercel

A full-width alert banner notifying the user of an overdue payment, with a call to action to update the payment method.

Vercel — Notification Toast component
Vercel logo
Vercel

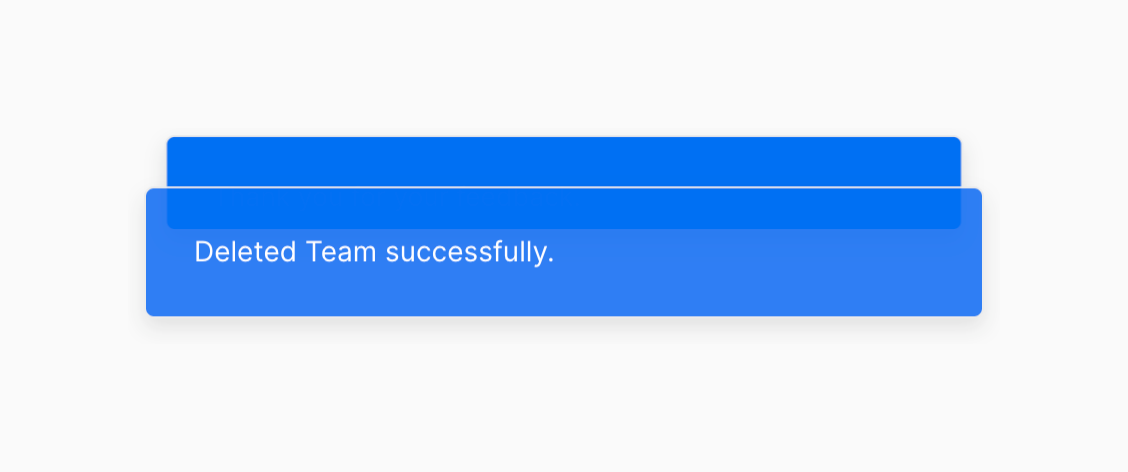
A stacked toast notification showing a success message for deleting a team.

Vercel — Alert component
Vercel logo
Vercel

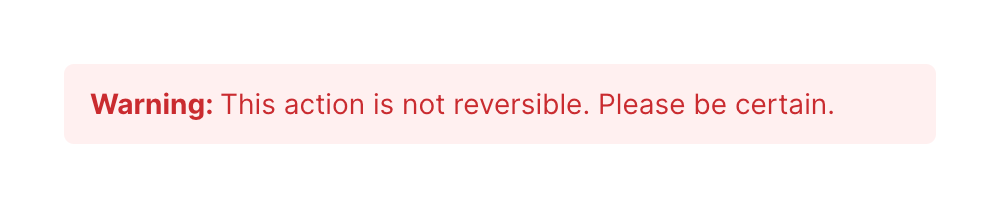
A simple inline alert box with a light red background and dark red text warning the user that an action is irreversible.

Vercel — Input text component
Vercel logo
Vercel

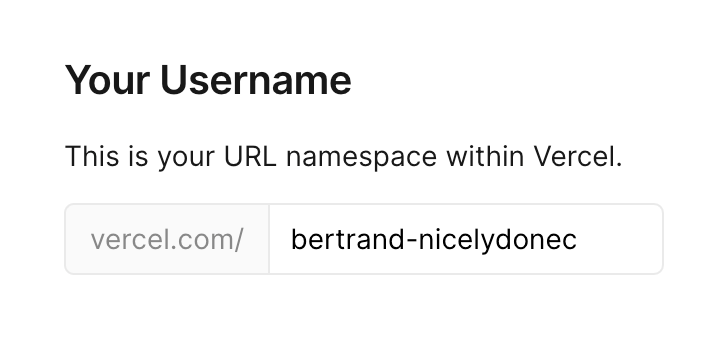
A text input field for setting a username, featuring a fixed prefix indicating the URL namespace.
Vercel — Theme settings component
Vercel logo
Vercel

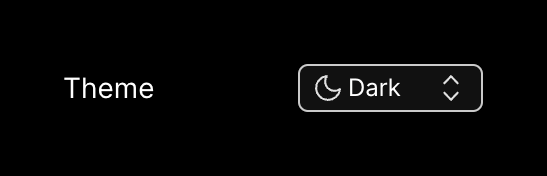
A form field row containing a label 'Theme' and a dropdown select input currently set to 'Dark', featuring a moon icon.
Vercel — Theme settings component
Vercel logo
Vercel

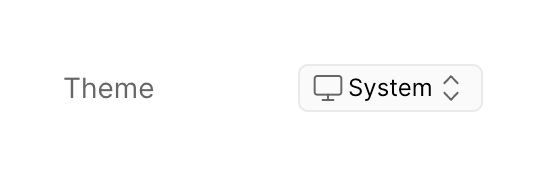
A row containing a 'Theme' label and a dropdown select menu currently set to 'System'.

Vercel — Avatar component
Vercel logo
Vercel

A user profile row displaying a circular gradient avatar, a username, and an email address.

Vercel — Table component
Vercel logo
Vercel

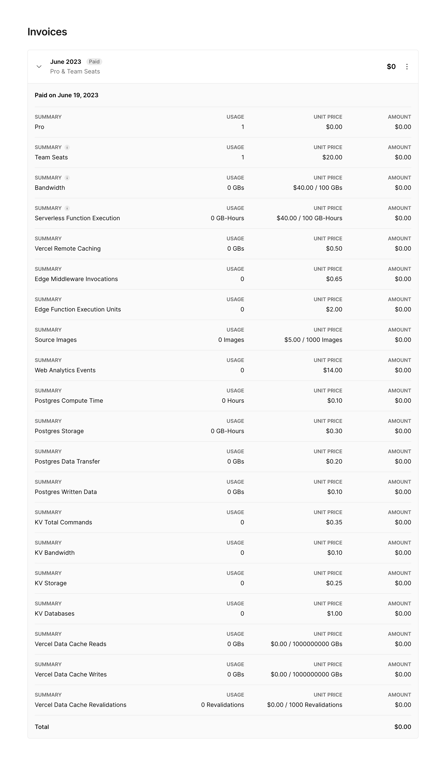
An expanded accordion showing a detailed breakdown of a monthly invoice. It lists various services, their usage, unit price, and total amount, concluding with a total row.

Vercel — Code block component
Vercel logo
Vercel

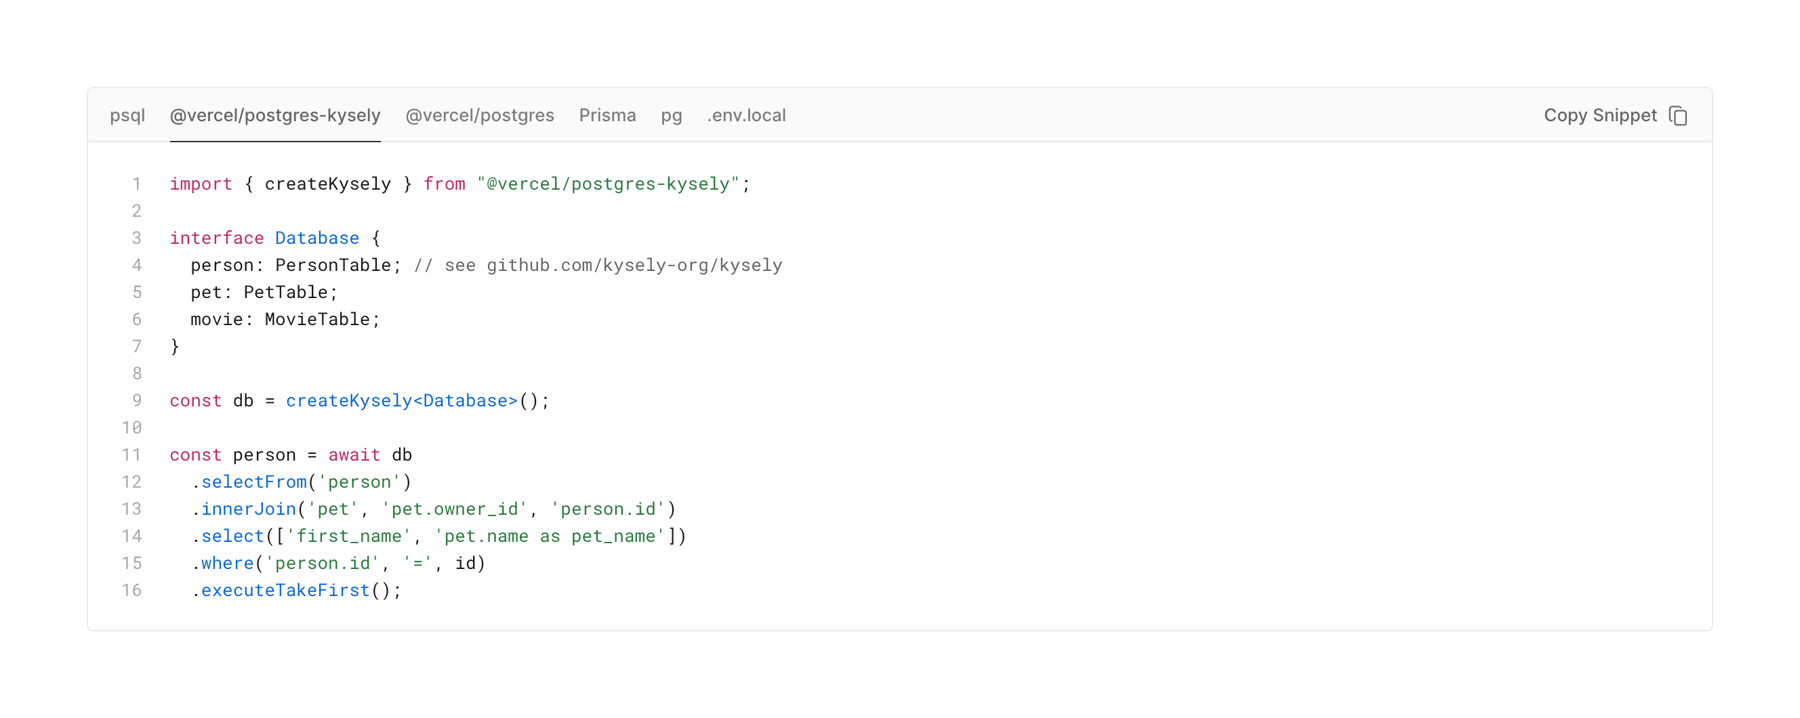
A code block component displaying a connection snippet. It features a top tab bar to switch between different languages or frameworks, a 'Copy Snippet' button, and syntax-highlighted code with line numbers.
Vercel — Charts component
Vercel logo
Vercel

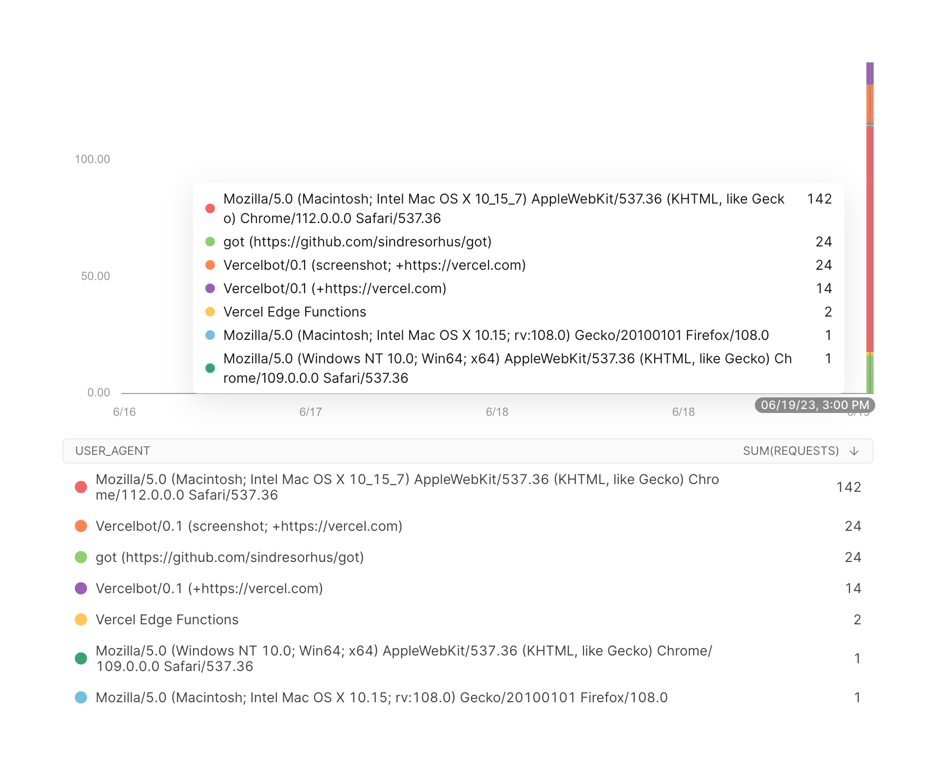
A stacked bar chart showing requests over time, with a detailed tooltip displaying the breakdown for a specific timestamp. Below the chart is a data table listing the user agents and their corresponding request counts.

Browse the full component library

Browse the full UI component library.

Trusted by the best teams