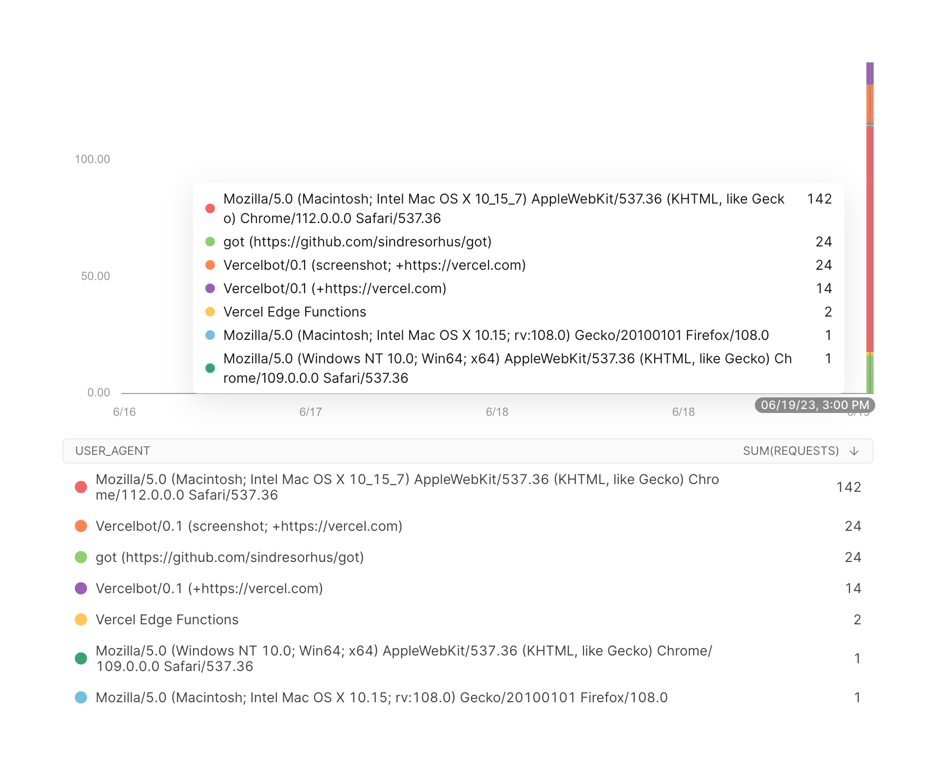
Chart with tooltip and data table
A stacked bar chart showing requests over time, with a detailed tooltip displaying the breakdown for a specific timestamp. Below the chart is a data table listing the user agents and their corresponding request counts.
Explore the examples

Browse the full component library
Browse the full UI component library.
Trusted by the best teams







