Bar chart
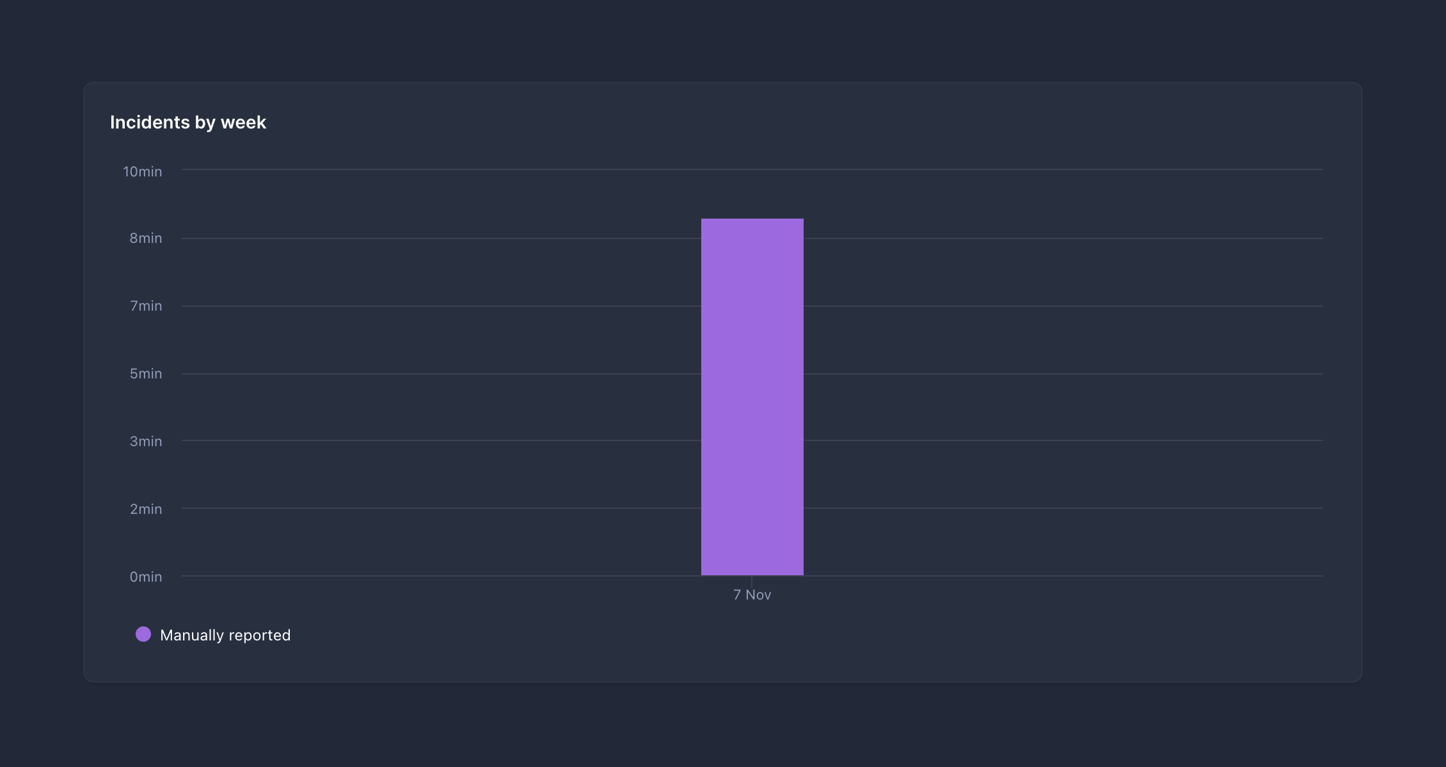
A bar chart displaying incidents by week, with a single purple bar representing manually reported incidents on November 7th.
Explore the examples

A bar chart displaying incidents by week, with a single purple bar representing manually reported incidents on November 7th.
Browse the full component library
Browse the full UI component library.
Trusted by the best teams







