Timeline Chart
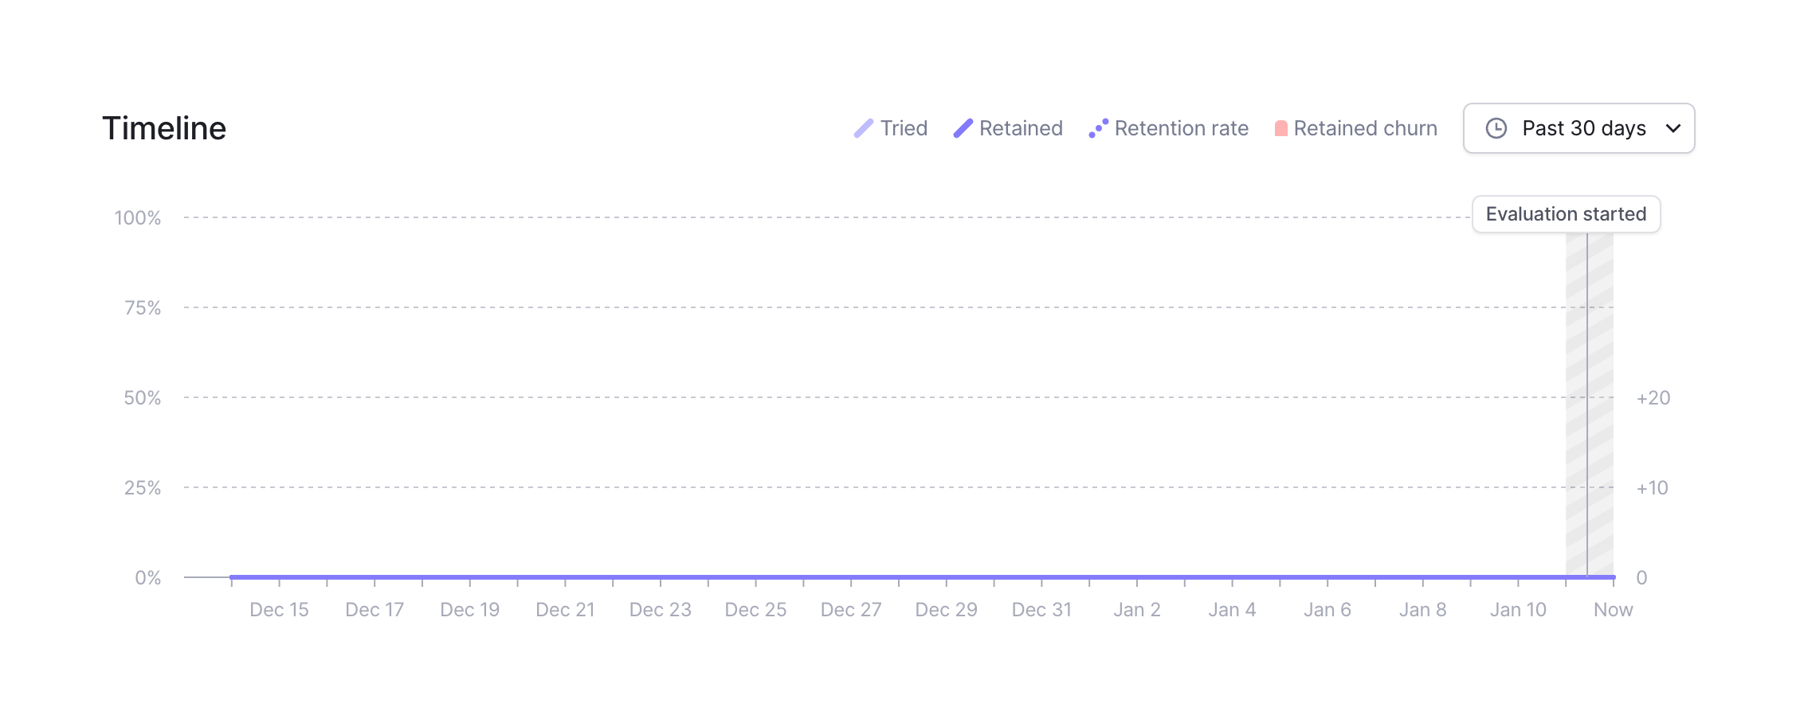
A line chart displaying timeline metrics over a 30-day period. It includes a legend for different data points, a date range selector, and an annotation for when an evaluation started.
Explore the examples

Browse the full component library
Browse the full UI component library.
Trusted by the best teams







