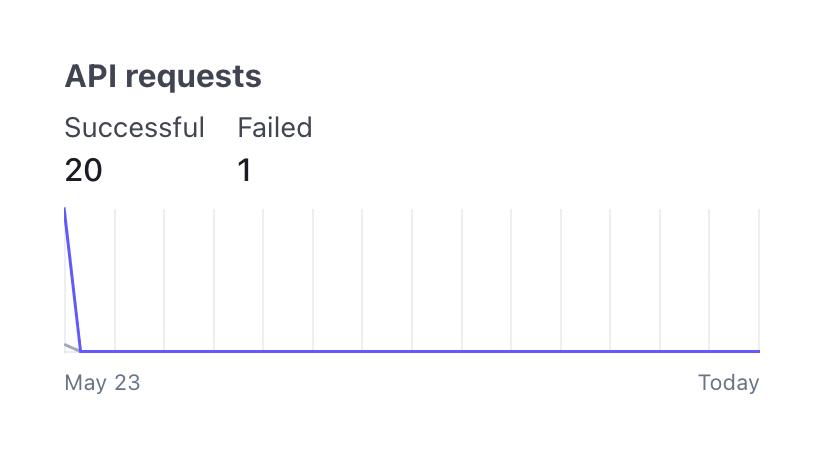
API Requests Line Chart
A line chart displaying the number of successful and failed API requests over time. It includes a title, summary metrics for successful and failed requests, and a line graph with a date range on the x-axis.
Explore the examples

Browse the full component library
Browse the full UI component library.
Trusted by the best teams







