Engagement Area Chart
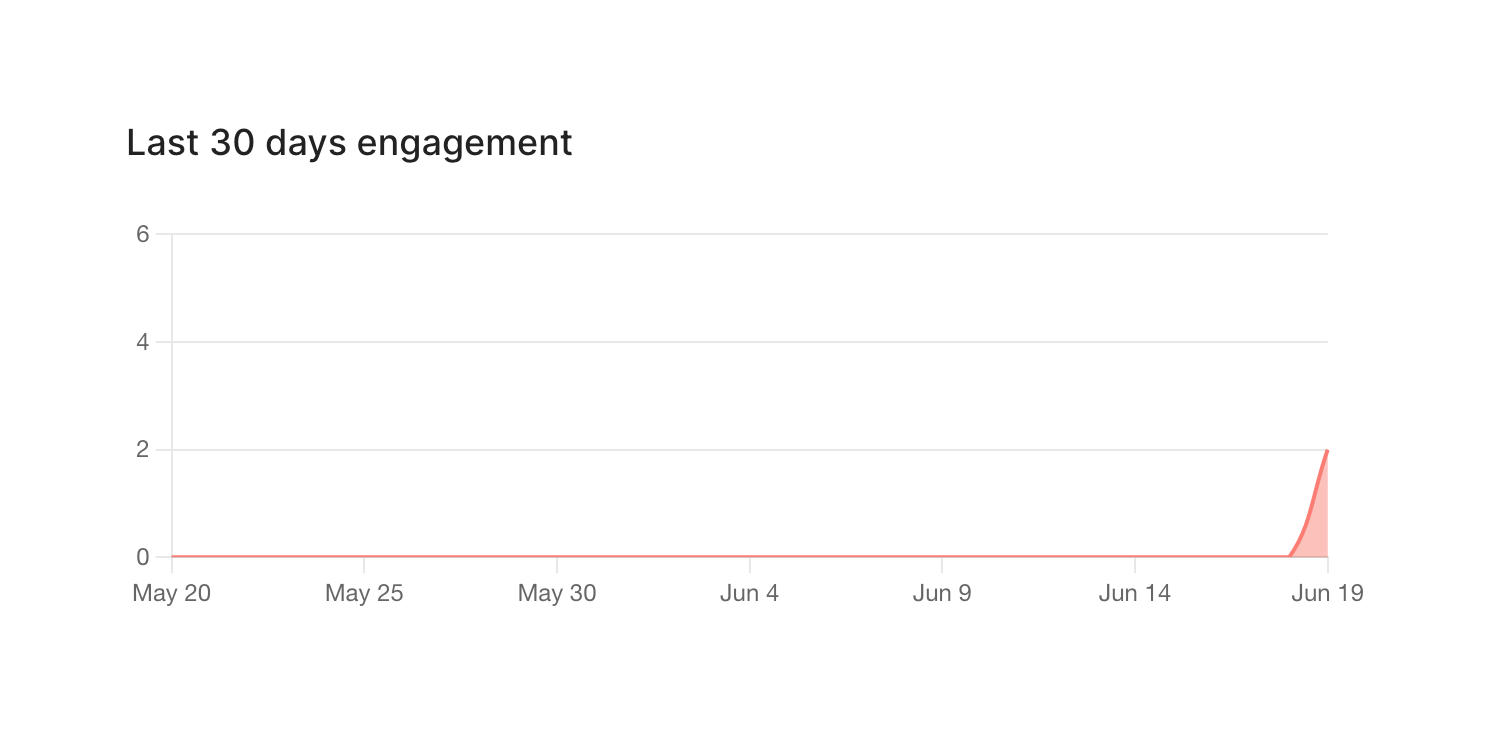
A simple area chart displaying engagement over the last 30 days, with a flat line that spikes at the end of the date range.
Explore the examples

Browse the full component library
Browse the full UI component library.
Trusted by the best teams







