KPI Donut Charts
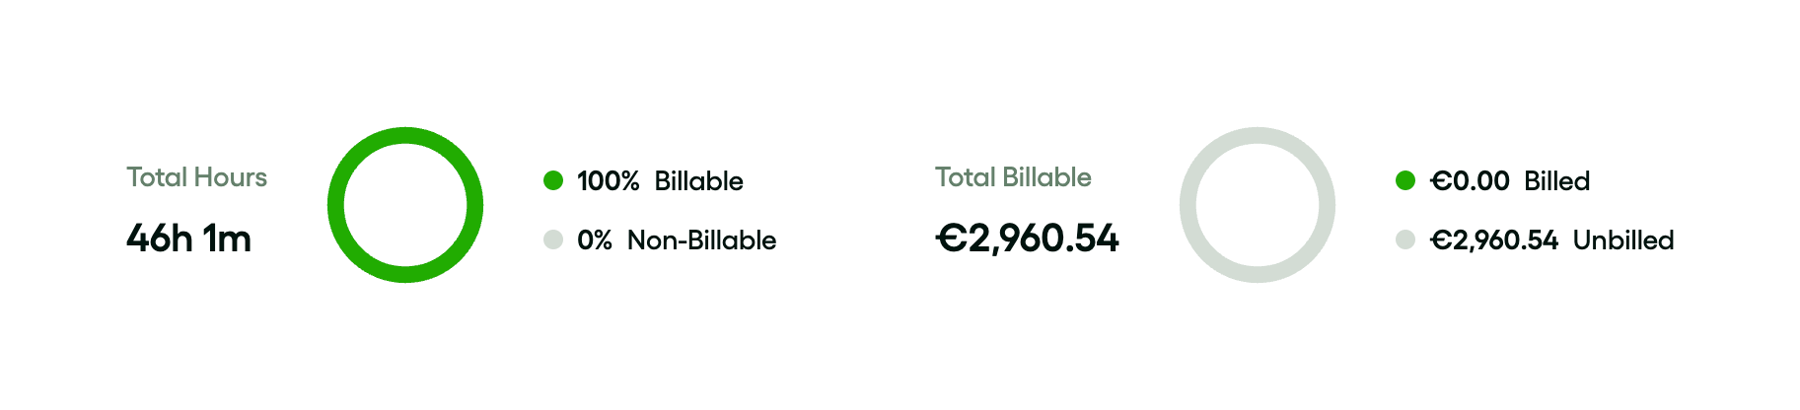
A pair of donut charts displaying key performance indicators for time tracking. The left chart shows total hours split by billable and non-billable, while the right chart shows total billable amount split by billed and unbilled.
Explore the examples

Browse the full component library
Browse the full UI component library.
Trusted by the best teams







