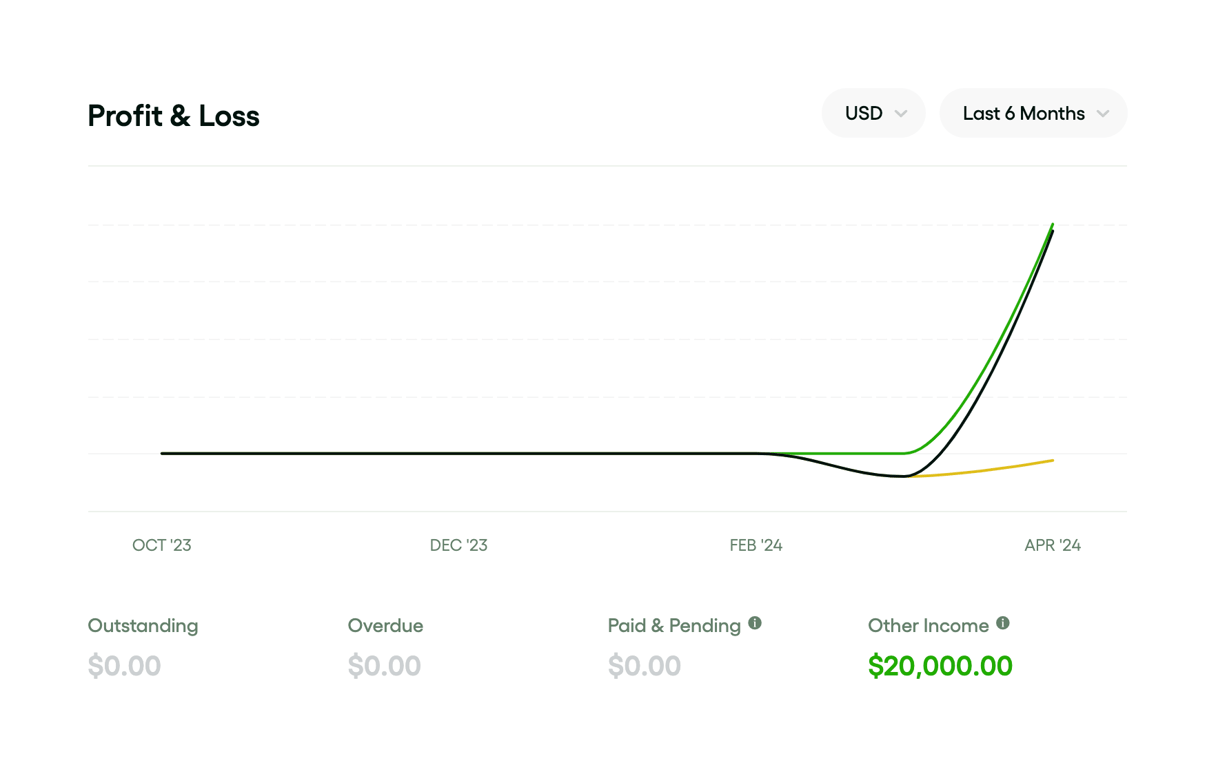
Profit & Loss Line Chart
A line chart displaying profit and loss over a 6-month period, with dropdowns for currency and time range, and a summary KPI row below.
Explore the examples

Browse the full component library
Browse the full UI component library.
Trusted by the best teams







