Skip to content

Fey UI components examples

Browse Fey UI component design examples. Preview individual interface elements and explore related component categories. Strategic, secure investing for everyday traders

Explore the examples
Fey — Alert component
Fey logo
Fey

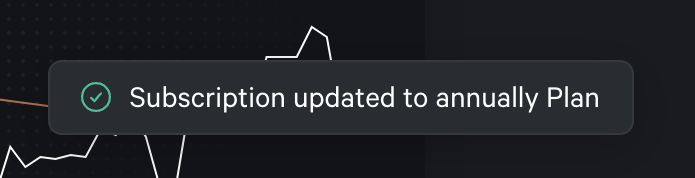
A dark-themed toast notification confirming a subscription update, featuring a green success icon and white text.

Fey — Sorting & filtering component
Fey logo
Fey

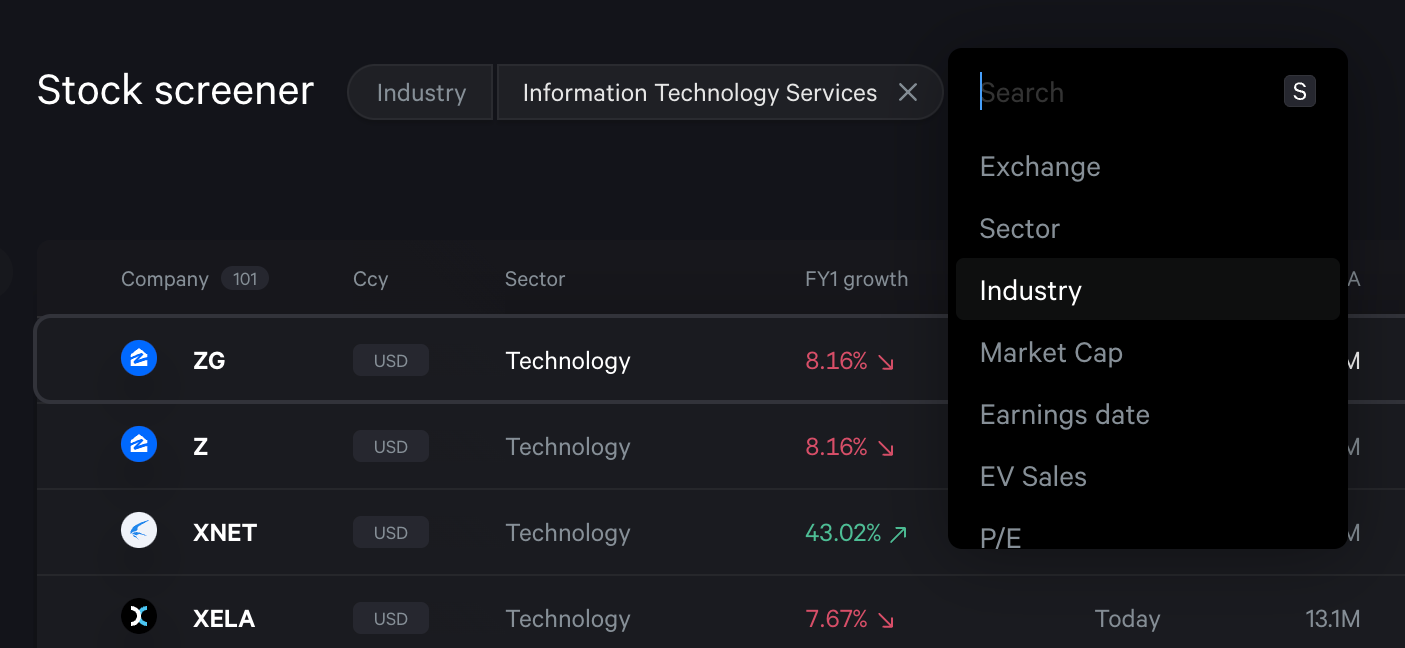
A dropdown menu overlaying a data table, providing a list of filter categories like Exchange, Sector, and Industry. The menu includes a search input at the top with a keyboard shortcut indicator.

Fey — Sorting & filtering component
Fey logo
Fey

A page header containing a title and an active filter chip with a clear button, followed by an add filter button.

Fey — Alert component
Fey logo
Fey

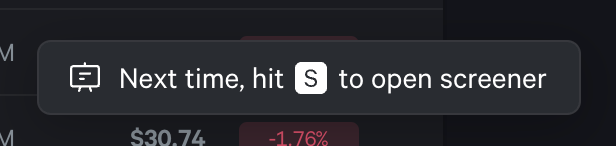
A dark-themed toast notification suggesting a keyboard shortcut to open the screener.

Fey — Notification Toast component
Fey logo
Fey

A dark-themed toast notification confirming that a stock ticker has been added to a list. It features a company logo and a brief confirmation message.
Fey — Charts component
Fey logo
Fey

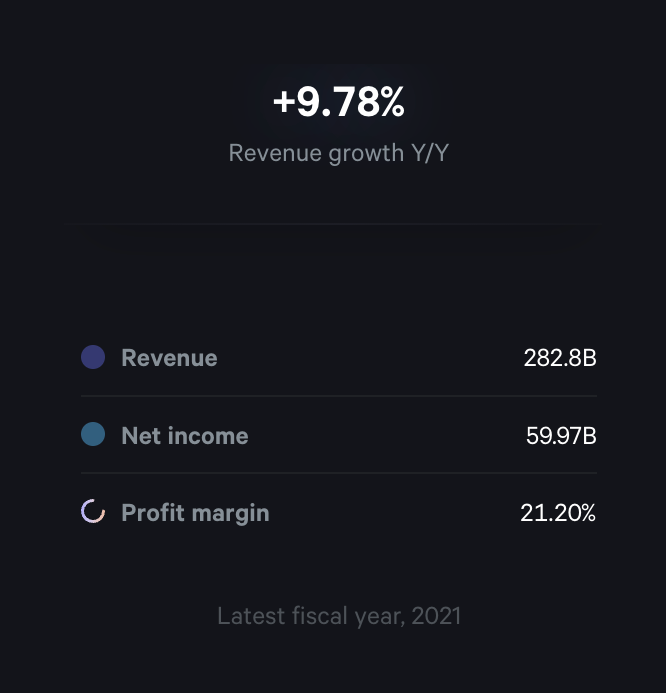
A dark-themed card displaying a primary growth metric at the top, followed by a list of related financial metrics with color-coded indicators.

Fey — Charts component
Fey logo
Fey

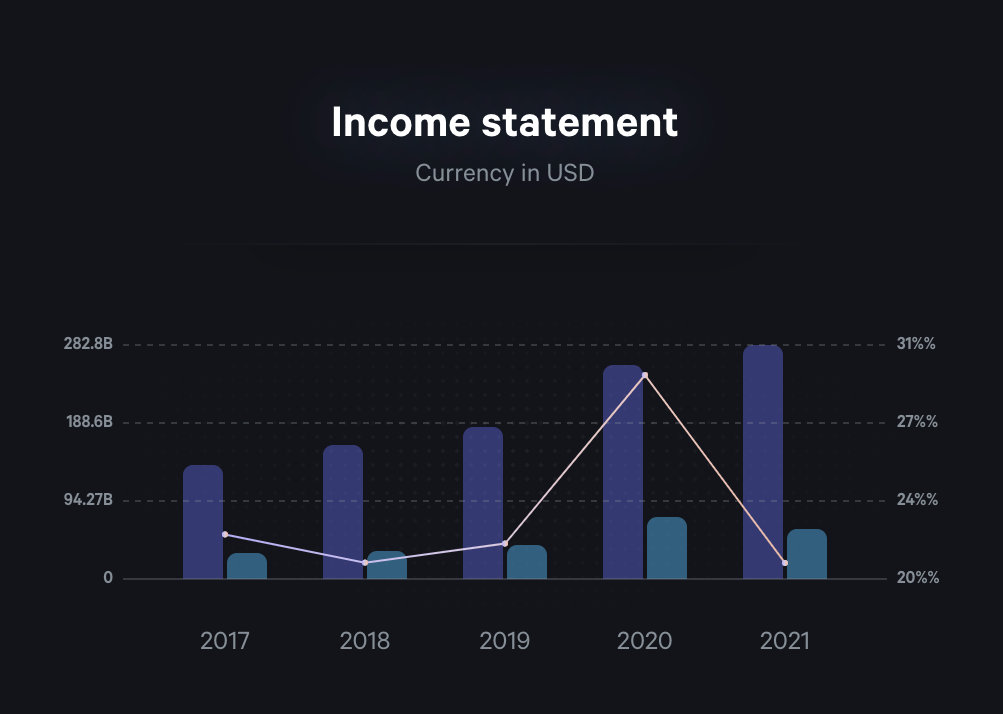
A combination bar and line chart displaying income statement data over a five-year period. It features dual y-axes for absolute values and percentages.

Fey — Charts component
Fey logo
Fey

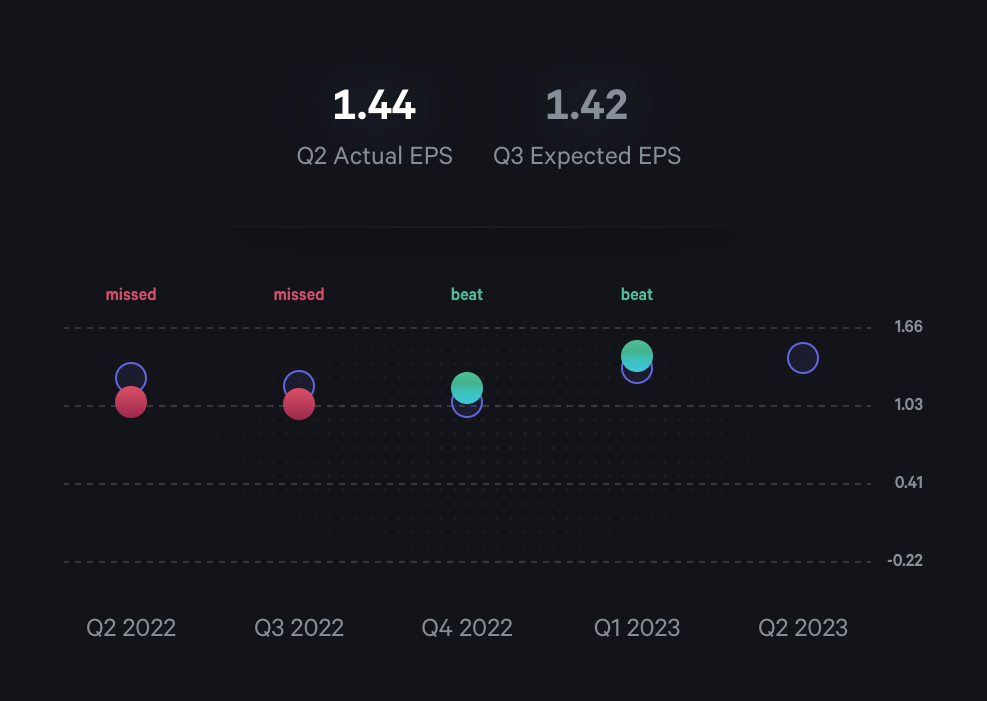
A scatter plot chart comparing actual vs expected Earnings Per Share (EPS) over several quarters. The chart uses colored dots to indicate whether the actual EPS 'missed' or 'beat' expectations, with a summary at the top showing the most recent actual and expected EPS figures.

Fey — Charts component
Fey logo
Fey

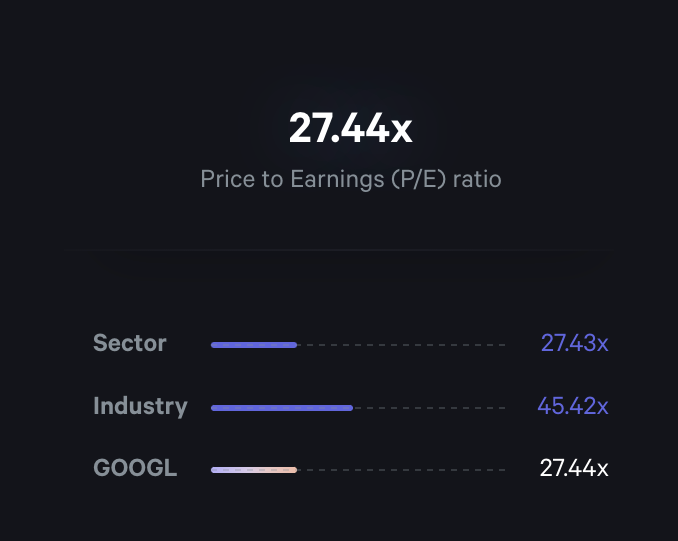
A financial data visualization showing a primary metric (Price to Earnings ratio) at the top, followed by a horizontal bar chart comparing the stock's P/E ratio against its sector and industry averages.

Fey — Charts component
Fey logo
Fey

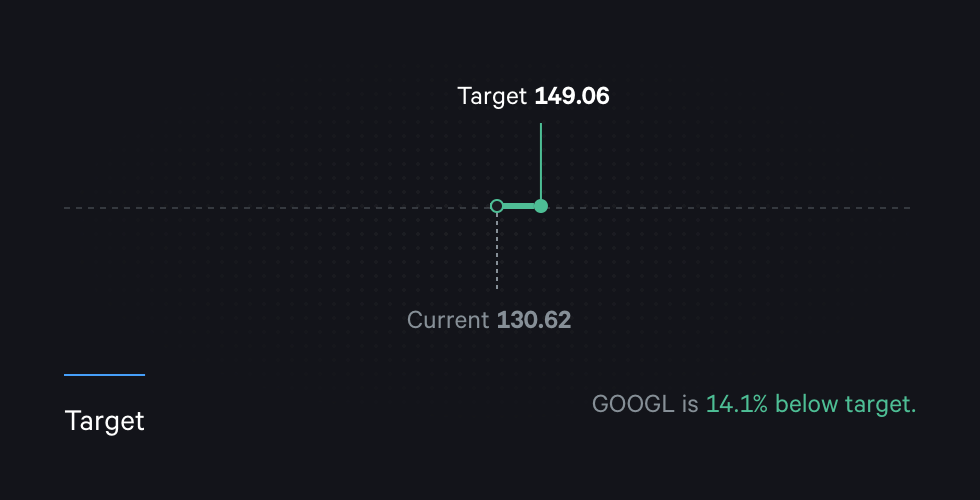
A minimalist chart displaying a stock's current price relative to a target price. It uses a horizontal dashed line as a baseline, with vertical lines connecting to the current and target values.

Fey — Charts component
Fey logo
Fey

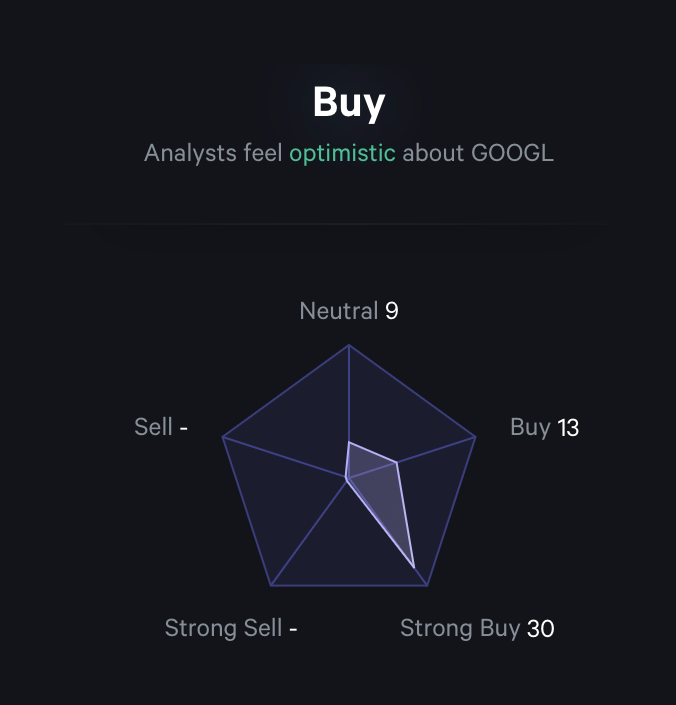
A radar chart displaying analyst ratings for a stock, categorized into Strong Buy, Buy, Neutral, Sell, and Strong Sell. A summary headline indicates the overall sentiment.

Fey — Charts component
Fey logo
Fey

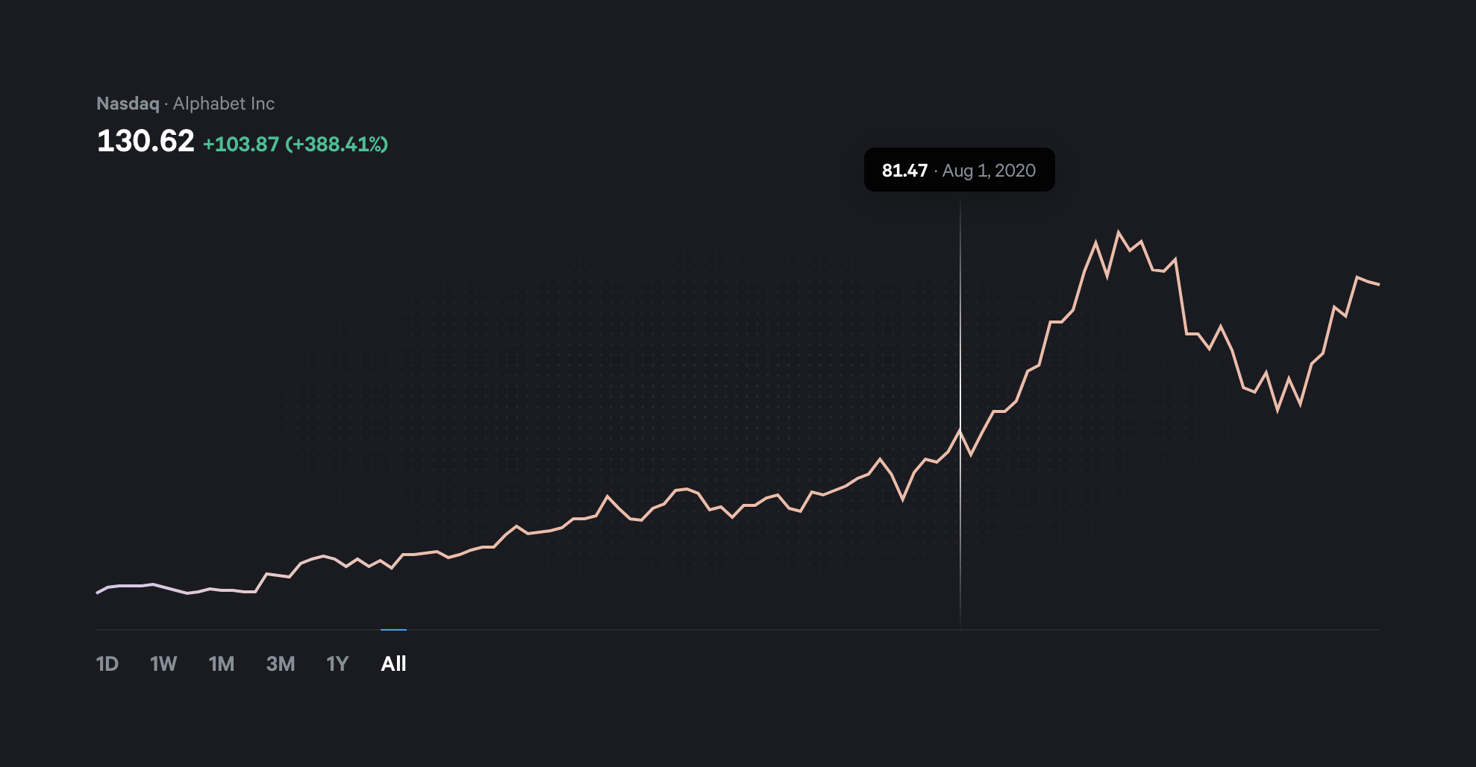
A line chart displaying historical stock price data with an interactive tooltip showing price and date at a specific point. It includes a header with the current price and performance, and a time range selector at the bottom.

Browse the full component library

Browse the full UI component library.

Trusted by the best teams