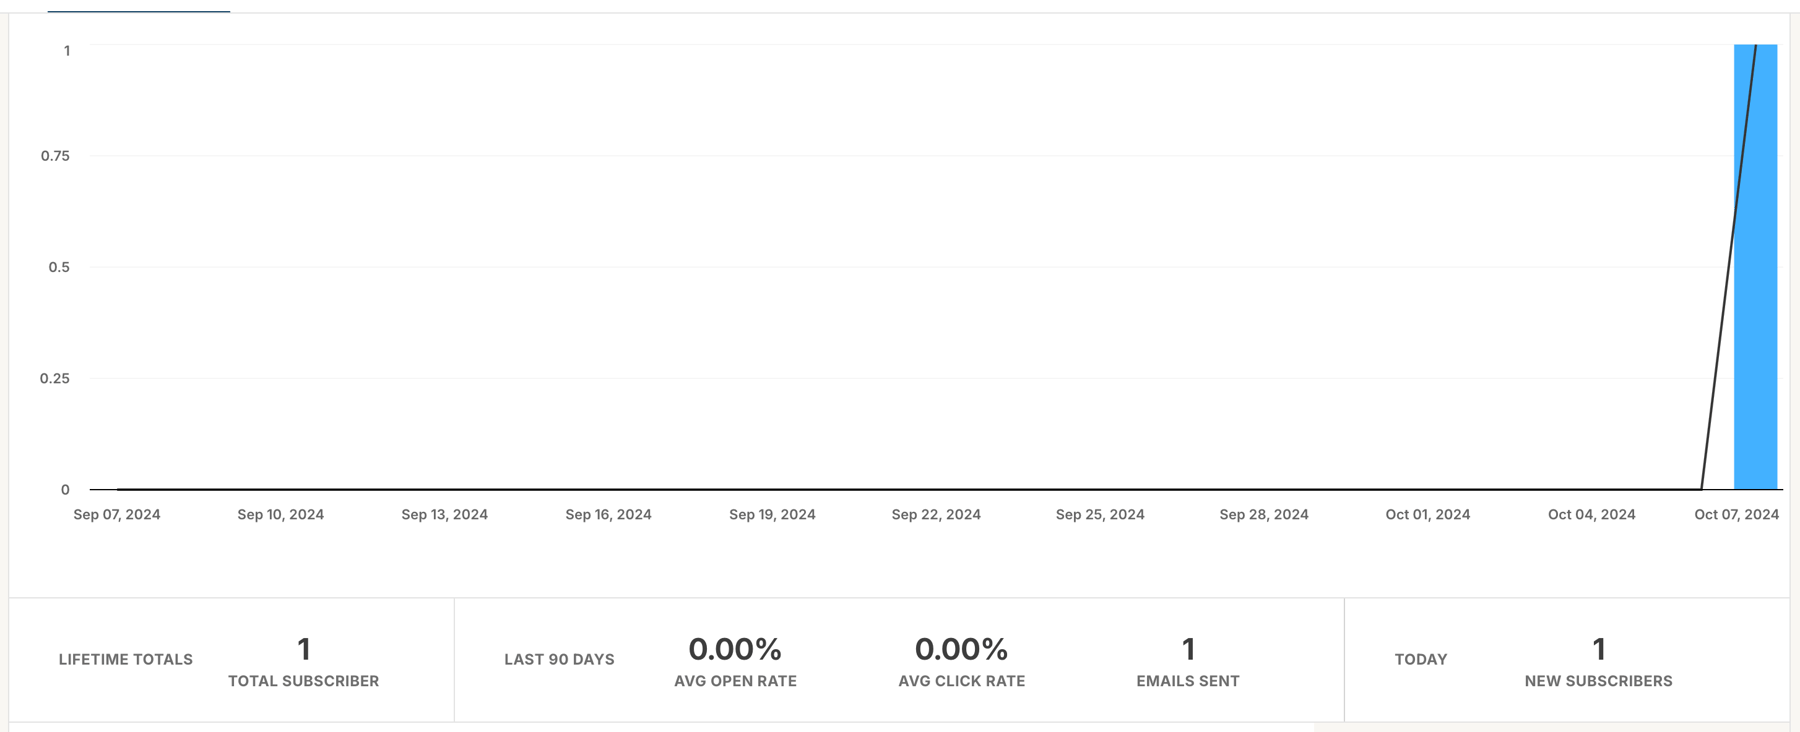
Subscriber Growth Chart and KPIs
A line and area chart showing subscriber growth over a 30-day period, with a single data point on the final day. Below the chart is a row of KPI tiles displaying lifetime totals, 90-day averages, and today's metrics.
Explore the examples

Browse the full component library
Browse the full UI component library.
Trusted by the best teams







