Contributors Graph Dashboard
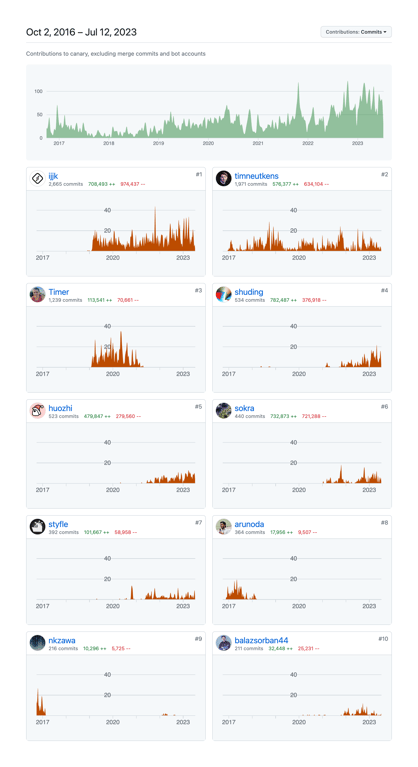
A dashboard displaying a main area chart of overall repository contributions over time, followed by a grid of individual contributor cards. Each card shows the contributor's rank, avatar, name, commit stats (additions and deletions), and a personal sparkline-style area chart of their activity.
Explore the examples

Browse the full component library
Browse the full UI component library.
Trusted by the best teams







