Commit Activity Charts
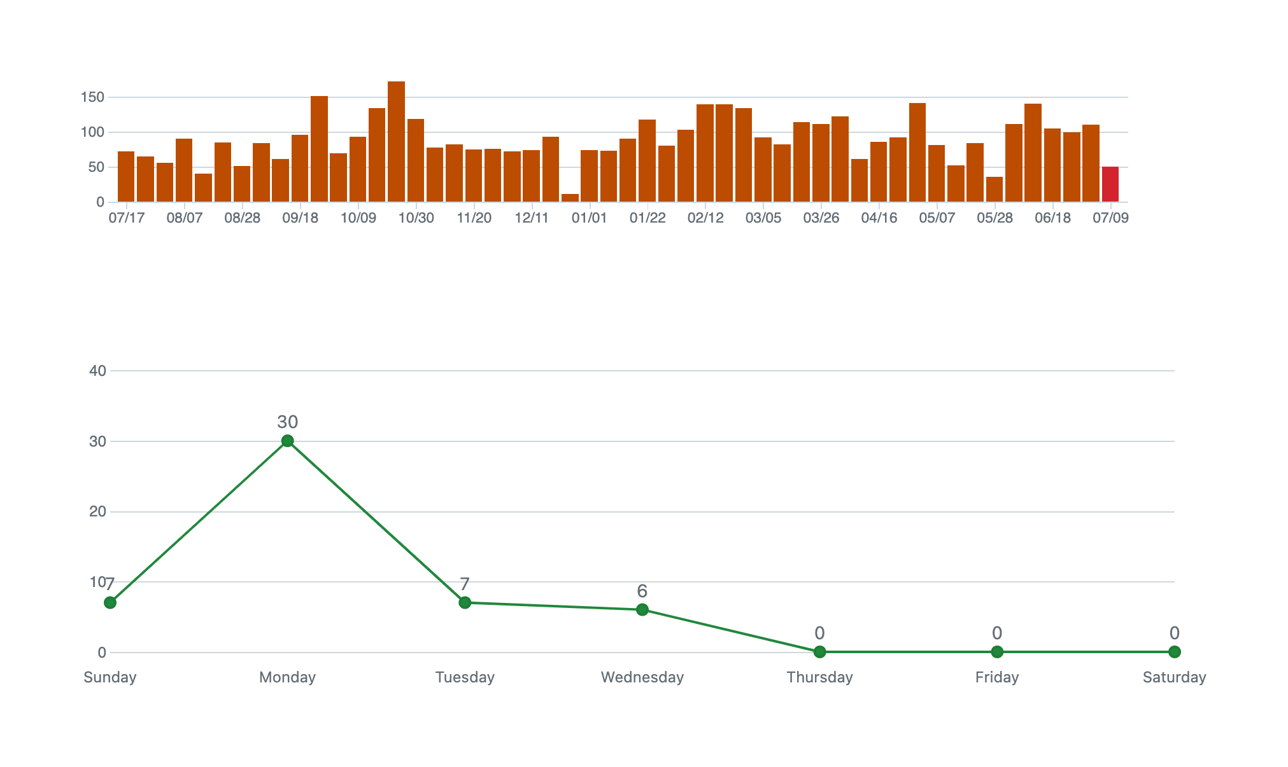
A stacked view of two charts showing commit activity over time. The top chart is a bar chart displaying weekly commit volume over a year, with the most recent week highlighted in red. The bottom chart is a line chart showing the daily distribution of commits for a selected week, with data points marked and labeled.
Explore the examples

Browse the full component library
Browse the full UI component library.
Trusted by the best teams







