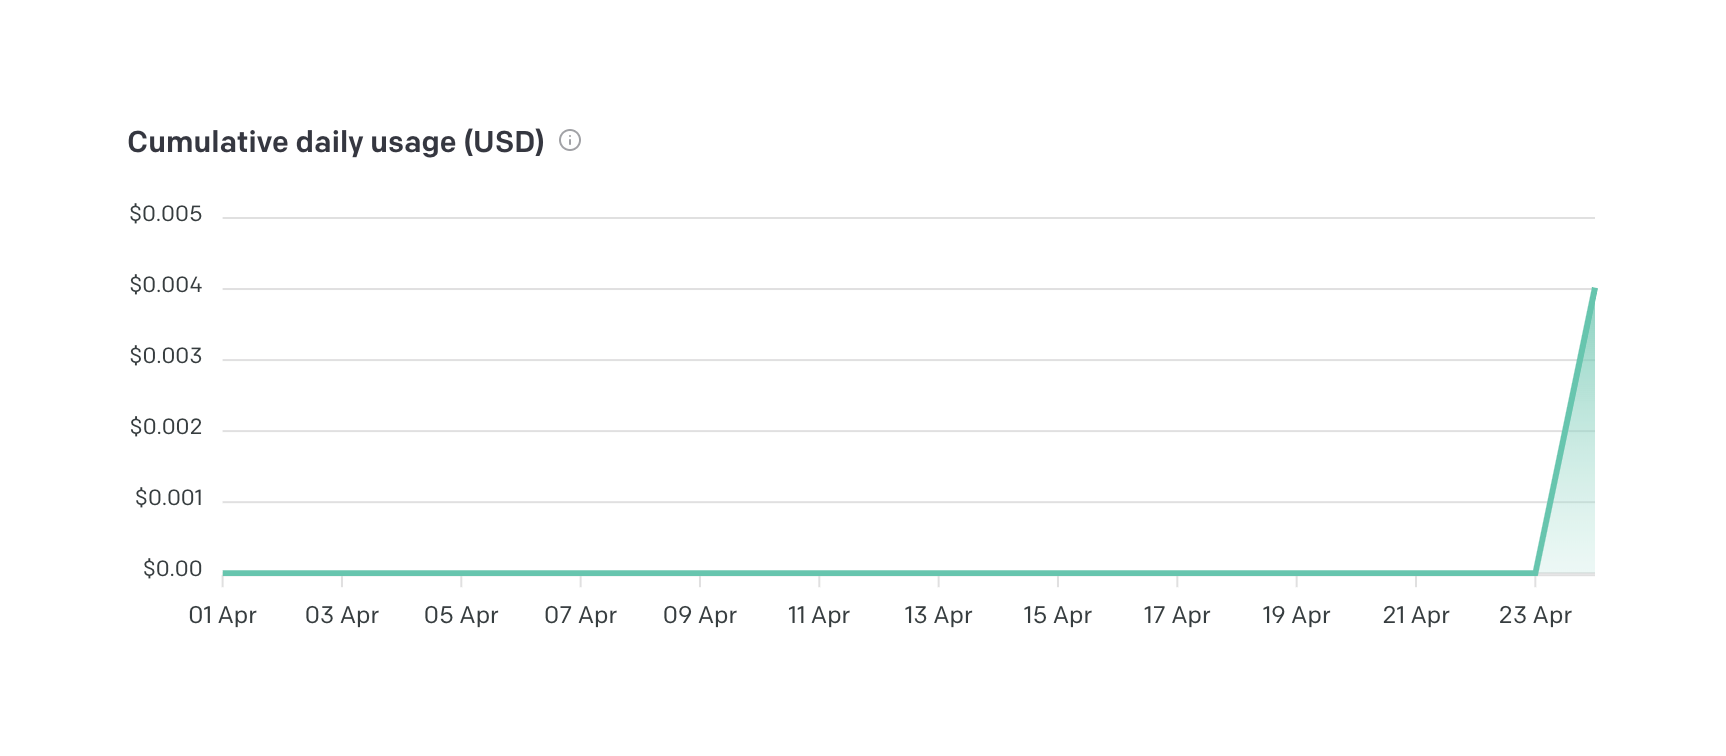
Cumulative Usage Area Chart
An area chart displaying cumulative daily usage in USD over a month. The y-axis shows dollar amounts in small increments, and the x-axis shows dates in April. A sharp spike is visible at the end of the timeline.
Explore the examples

Browse the full component library
Browse the full UI component library.
Trusted by the best teams







