Axiom user flows examples
Explore Axiom user flow examples. Preview the opening screens and steps for each task. The modern machine data platform.
Preview these flows

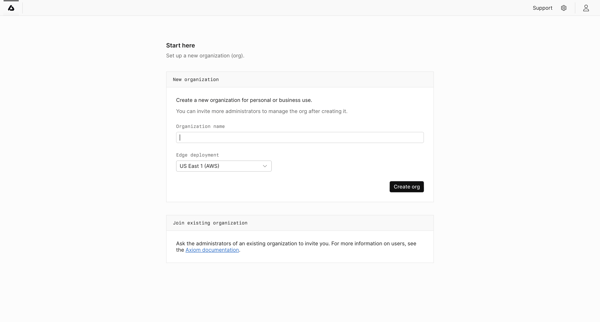
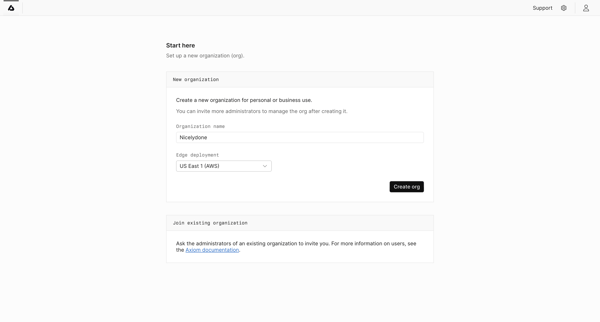
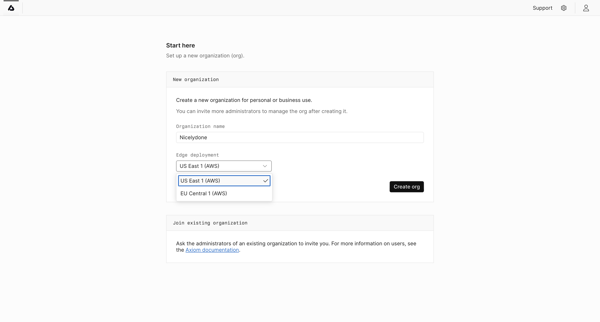
Onboarding journey for new Axiom users to create an organization with region selection, profile with role and company size, and complete a multi-step setup checklist
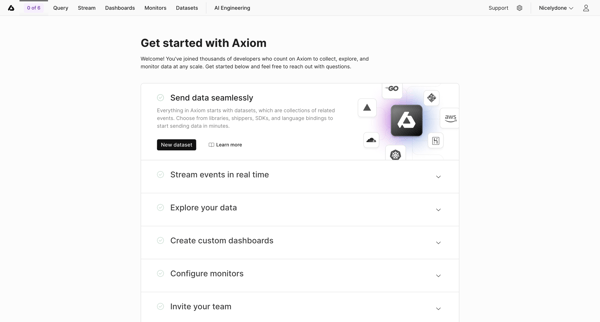
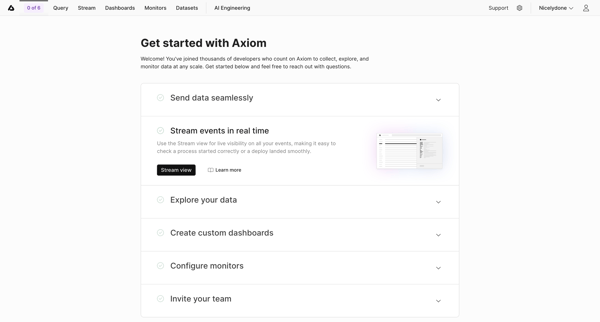
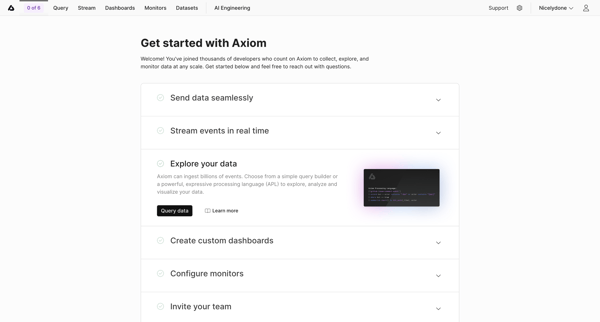
User views Axiom onboarding checklist covering send data, stream events, explore data, dashboards, monitors, and team invite
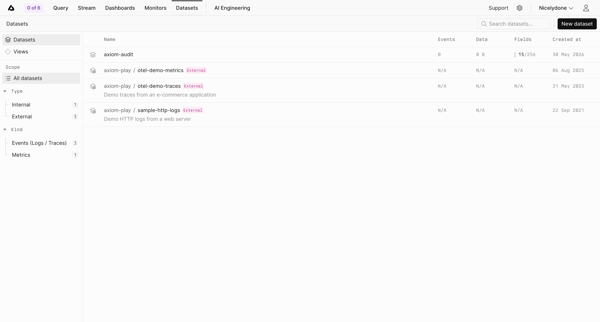
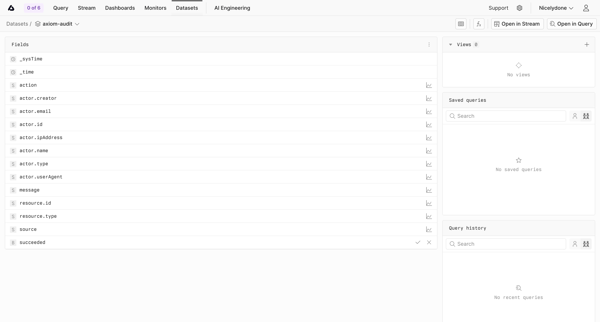
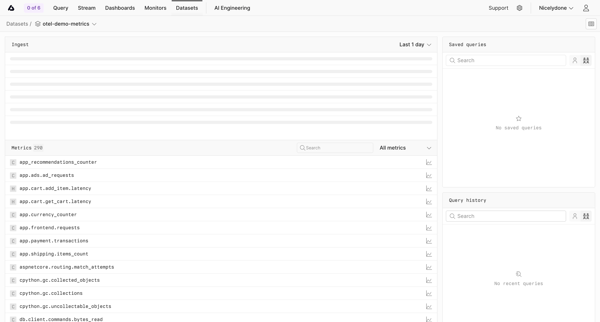
User searches and filters the datasets list, then navigates into detail views showing schema, metrics, ingest volume, and query history in Axiom.
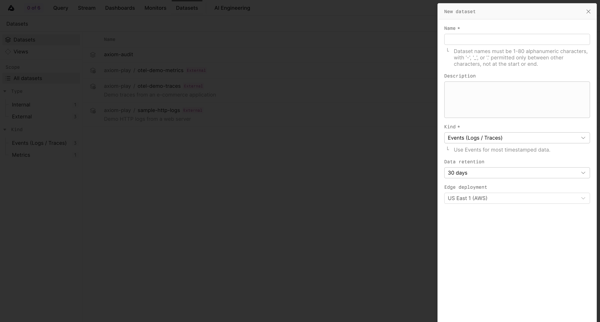
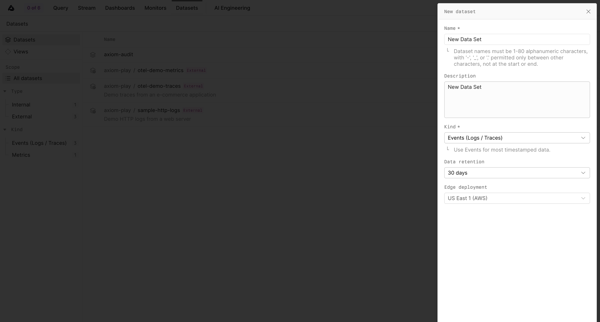
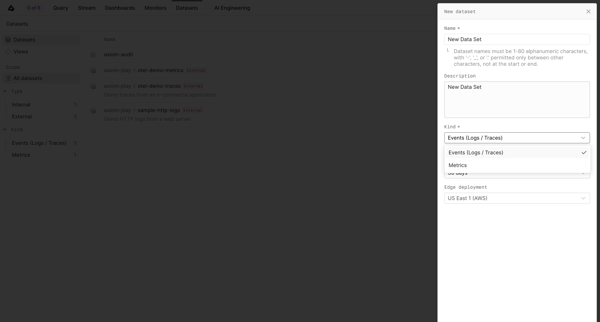
User configures a new dataset via side drawer form with name, description, kind, retention, and edge options, handles validation errors, then selects ingest method from integration grid
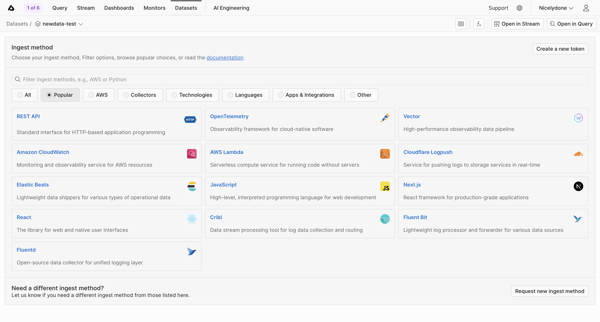
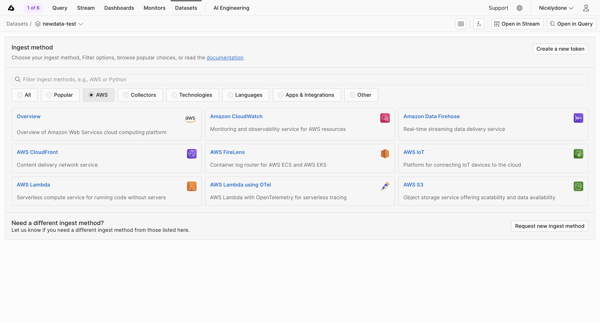
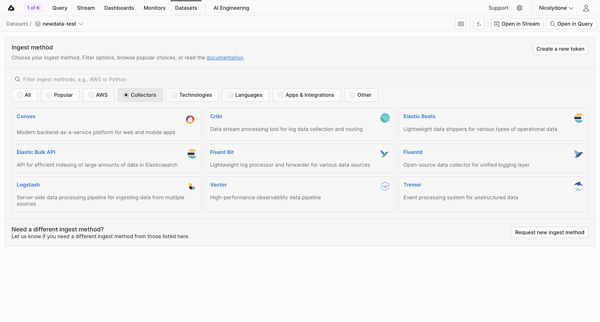
User searches, filters, and selects an ingest method from categorized grids of integrations for a specific dataset
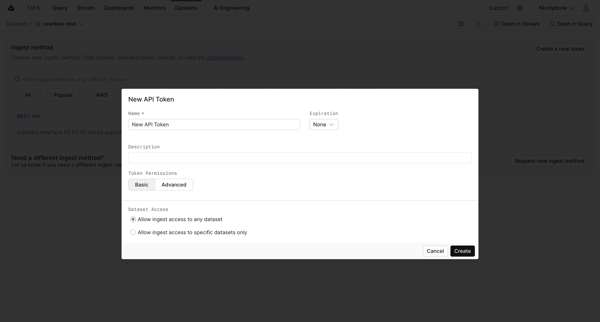
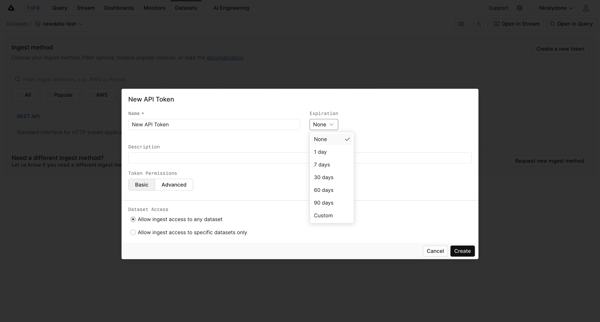
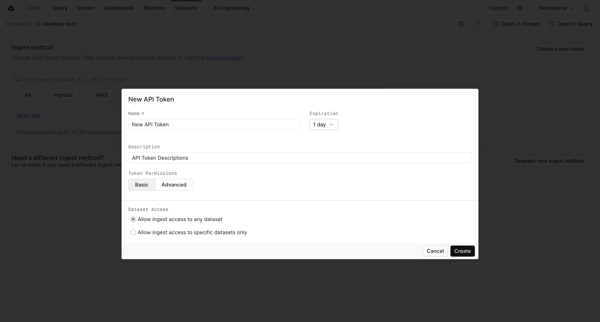
User opens create API token modal from settings or dataset detail, configures name/expiration/permissions matrix across datasets/views/org resources, then generates the token
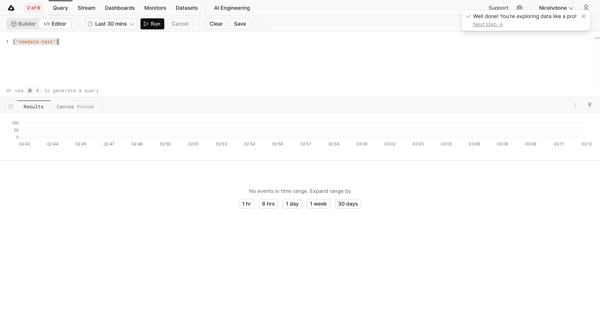
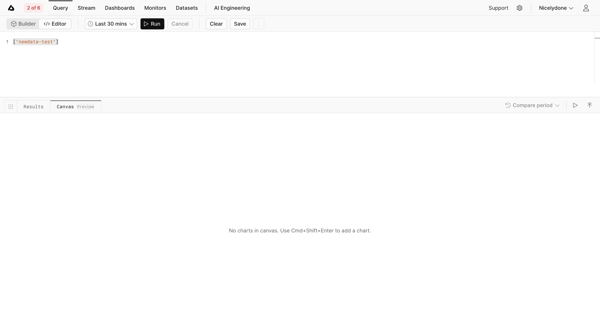
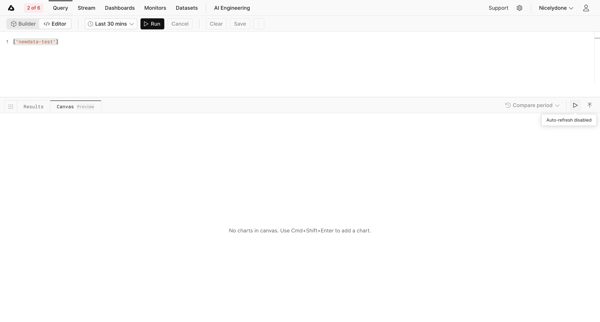
User builds queries in code or visual editors to search machine datasets, apply filters, time ranges, and summarization before viewing results
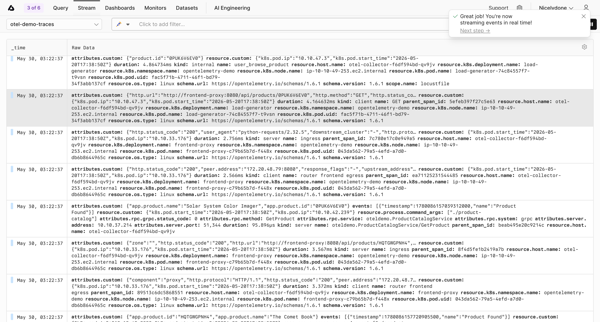
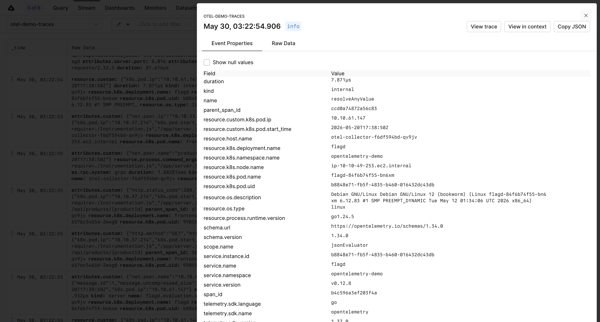
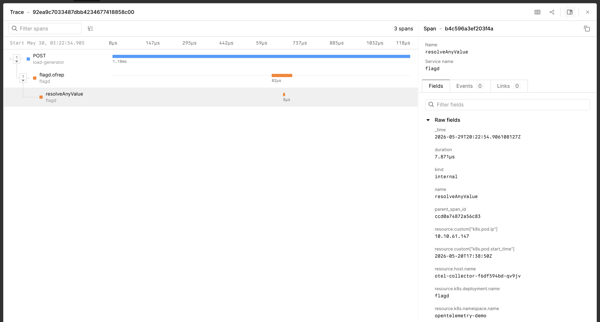
User monitors live trace streams of raw data, filters events, and inspects distributed trace details including span waterfalls and metadata in Axiom observability platform
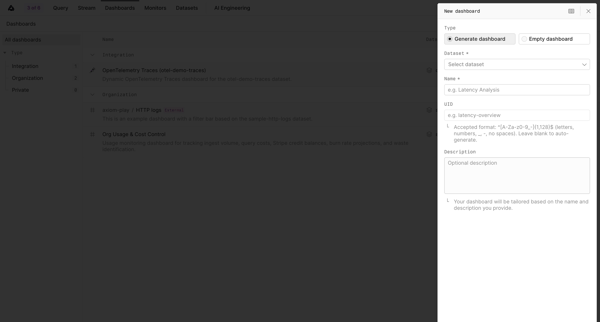
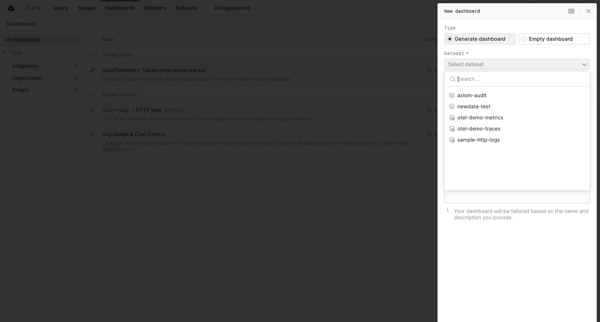
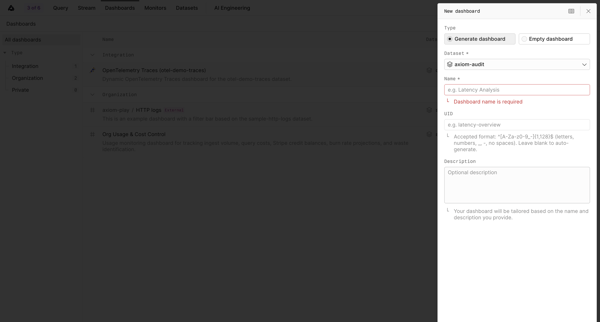
User opens New Dashboard Drawer, chooses AI generation or empty layout, selects dataset, enters name/UID/description, encounters validation and data errors, triggers generation, and lands on empty dashboard workspace
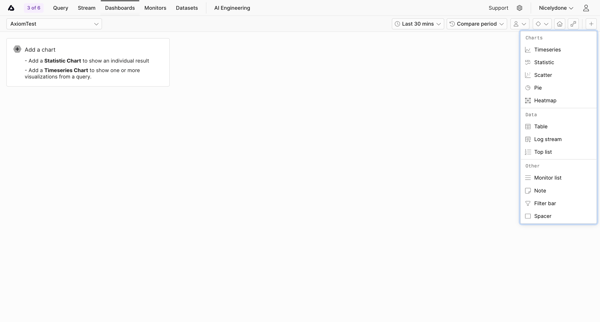
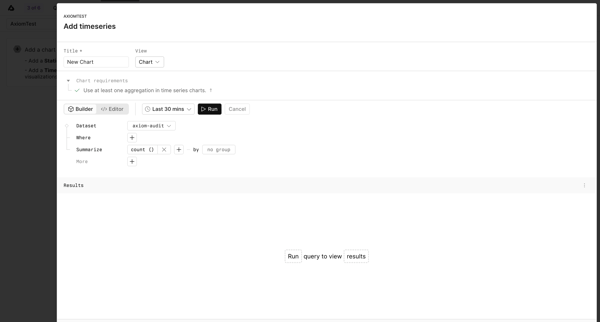
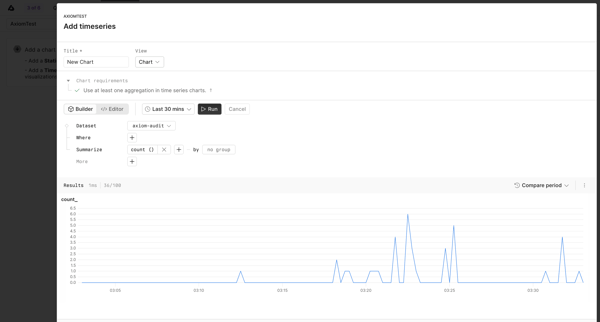
User starts from empty dashboard, opens chart builder modal, selects dataset, builds query with aggregations and filters, previews results live, and saves timeseries chart to dashboard
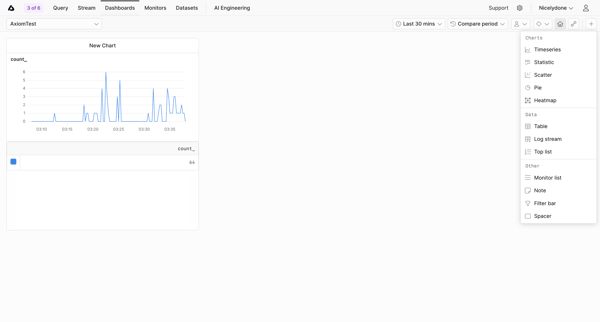
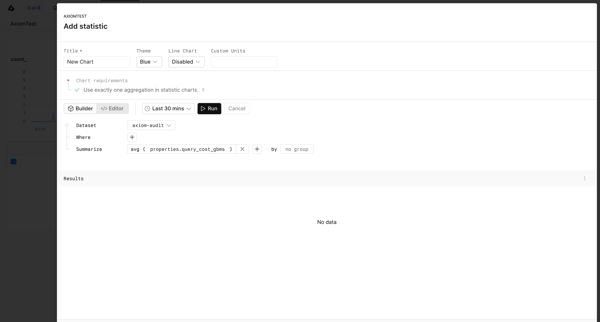
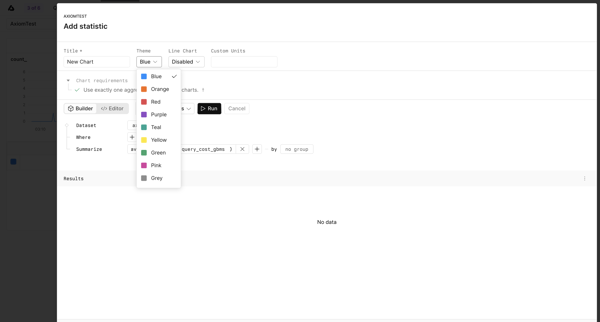
User starts in Dashboard Builder, opens successive modals to configure a statistic chart via dataset selection, query clauses, aggregations, and theme, then returns to Dashboard Editor with unsaved changes banner.
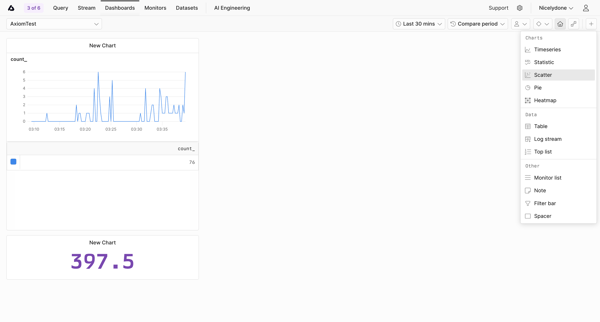
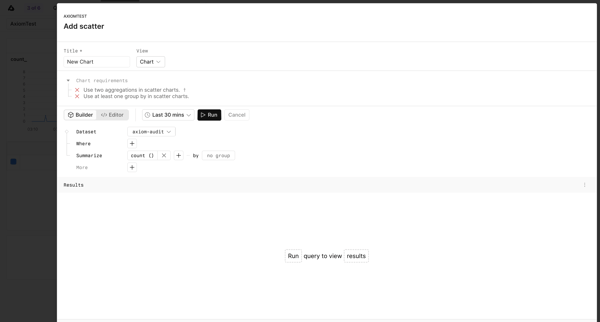
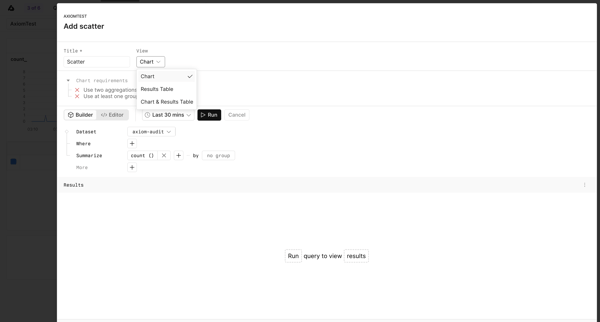
User creates a scatter chart from the dashboard editor by configuring dataset, filters, aggregations, view type, and title through sequential modals, including error states for validation.
Explore the full SaaS flow library
Browse the full SaaS flow library.
Trusted by the best teams







